Experimental results
Four assay perspectives, one limited proof-of-concept. Each observation is paired with its figure and the boundary of the conclusion.
We evaluated tetrathionate-associated reporter expression, cross-induction, biofilm biomass and cell compatibility in vitro. The figures below present our observations and their interpretation. Replicate-level measurements and analysis workbooks are not yet available in our public data record.
1. Tetrathionate tolerance and reporter expression
We measured growth and colony counts across 0.0–1.0‰ tetrathionate. Growth was similar through 0.6‰, while 0.8‰ and 1.0‰ were associated with lower growth and colony counts. A Western blot using human β-actin as a substitute reporter downstream of PttrB showed the strongest signal at 0.6‰. β-actin here is an inducible readout, not a bacterial housekeeping normalization control.
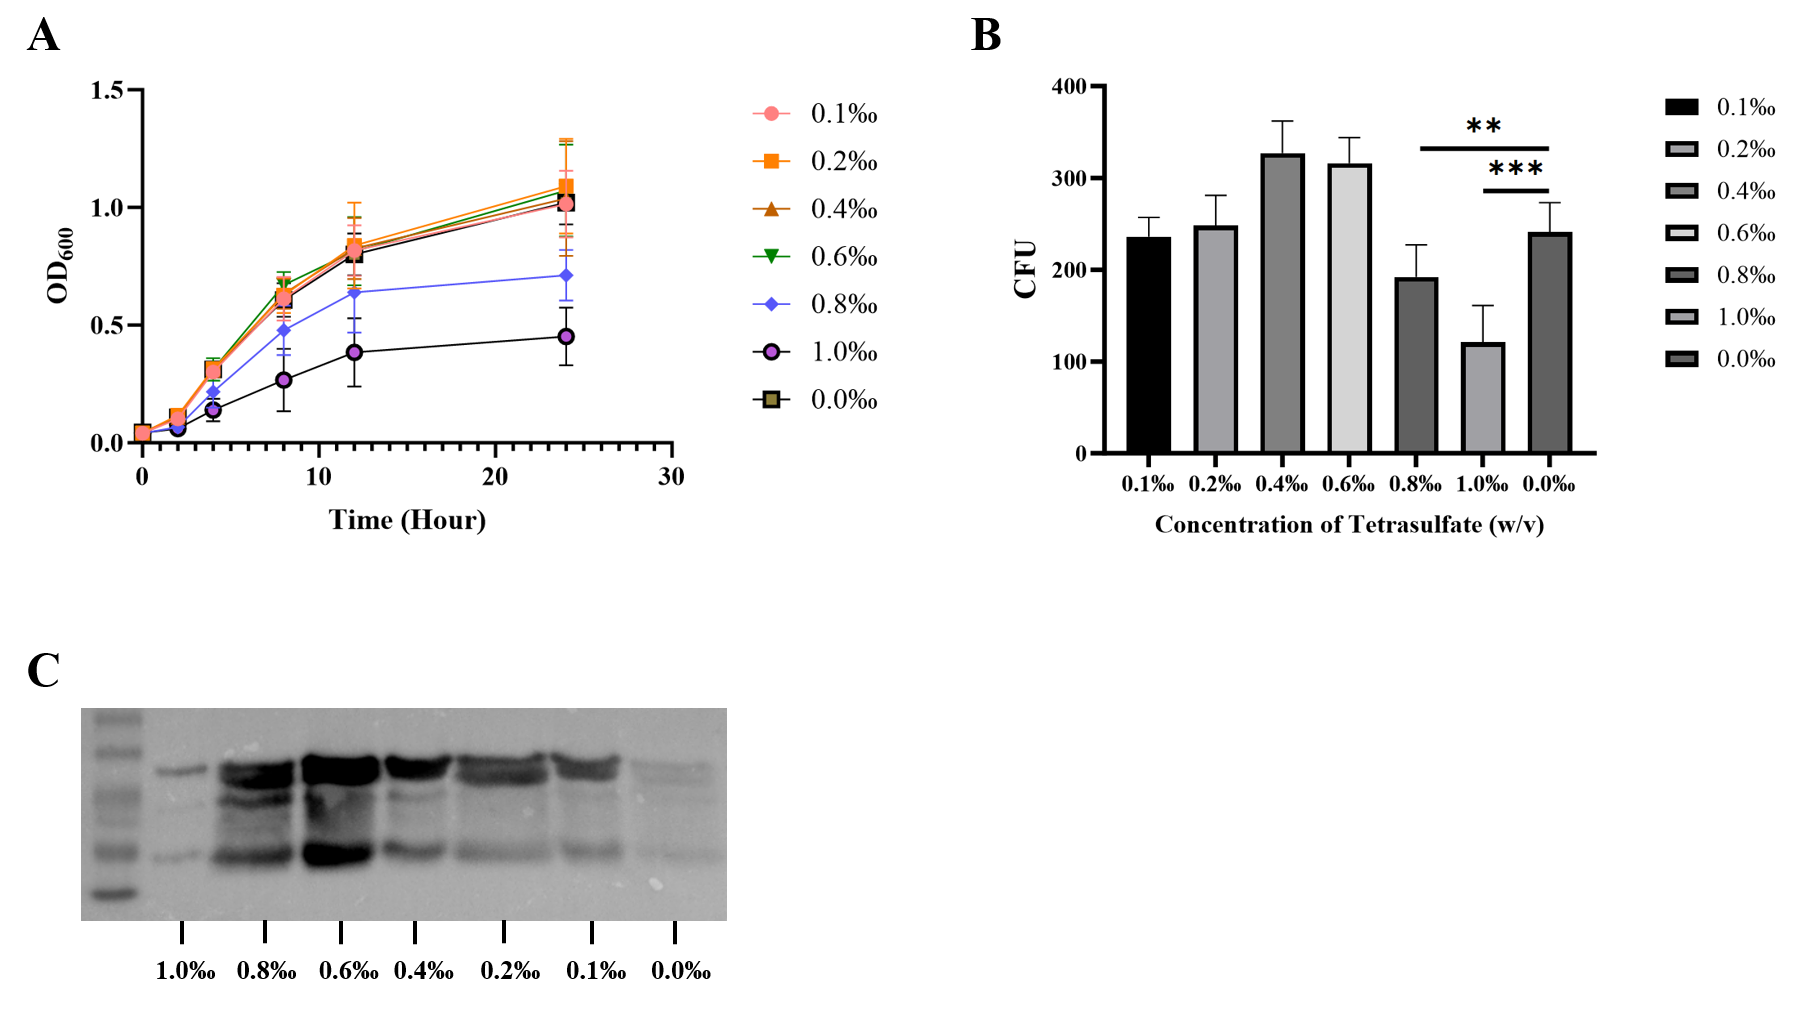
Interpretation: reporter expression peaked at 0.6‰, while growth decreased at the higher tested concentrations. We use per mille (‰), consistent with the assay gradient and figure labels. A conflicting “0.6%” entry in our results documentation remains to be reconciled with the original laboratory record. The figure’s CFU axis does not provide enough information to convert the bars to CFU/mL.
2. Cross-induction with culture filtrate and tetrathionate
We observed the strongest colorimetric signal with 0.6‰ tetrathionate and 10% Salmonella culture filtrate. No signal was observed in the tetrathionate-free condition. The heatmap also depicts a blank zero-filtrate row. Because the filtrate is a mixture of soluble culture products, this is a response to the filtrate proxy, not a direct measurement of AI-2 concentration.
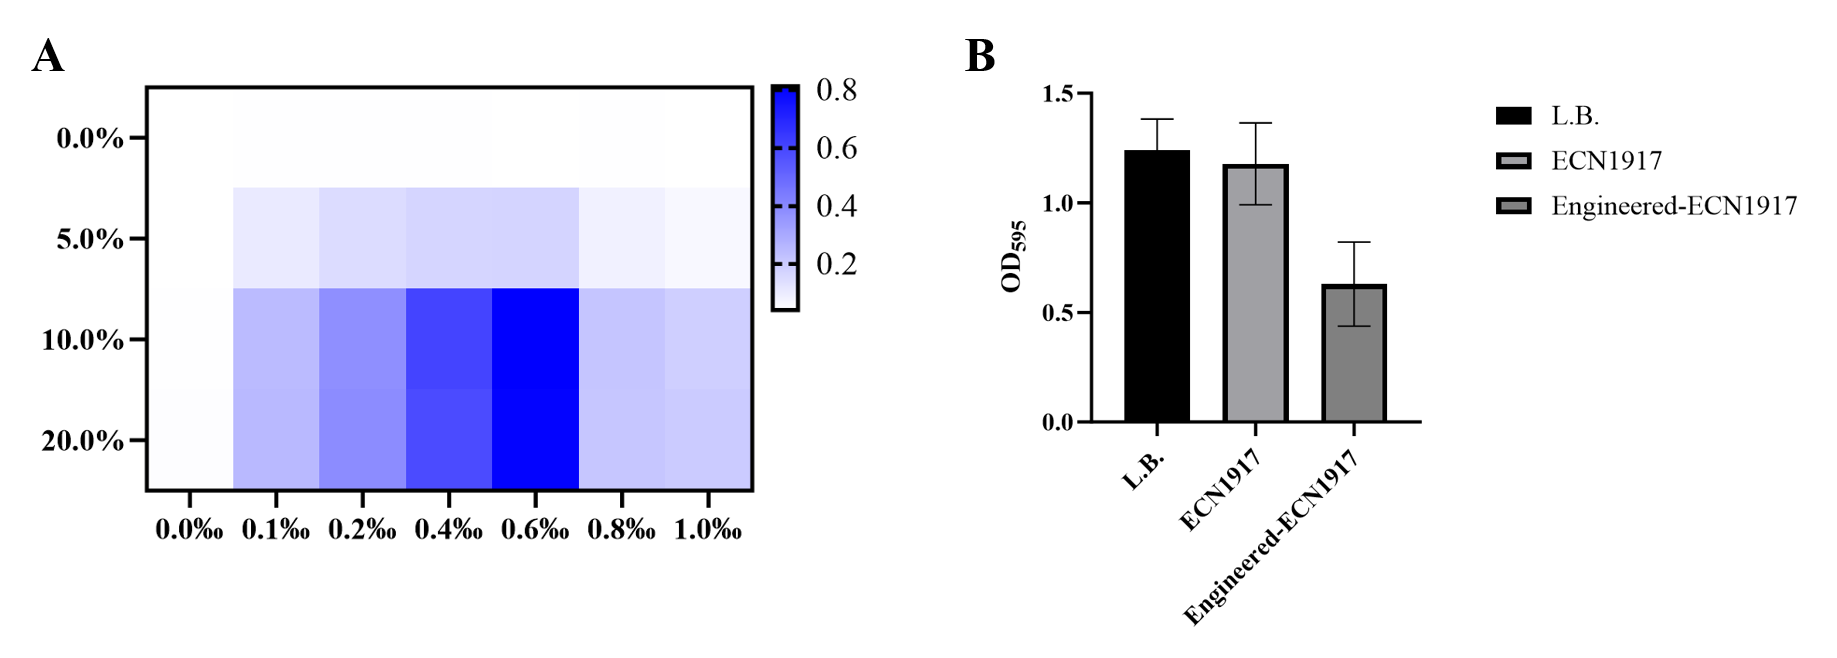
Our assay design combines seven tetrathionate levels with four filtrate levels, giving 28 combinations, as shown in the heatmap. An inconsistent total of 21 groups in our assay documentation remains to be checked against the original plate map. The workflow used 12 h of co-culture followed by 2 h with X-Gal; these measurements do not establish a visible response within one hour.
3. Crystal-violet biofilm assay
After a pre-formed Salmonella biofilm was exposed to LB medium, EcN, or engineered EcN, we measured OD595 values of 1.25 ± 0.13, 1.18 ± 0.18, and 0.62 ± 0.19, respectively. This assay measures retained crystal-violet-stained biomass. It does not by itself measure viable pathogen counts, prove biofilm eradication, establish an in-host effect, or attribute the change specifically to Microcin J25.
4. L-929 cell assay
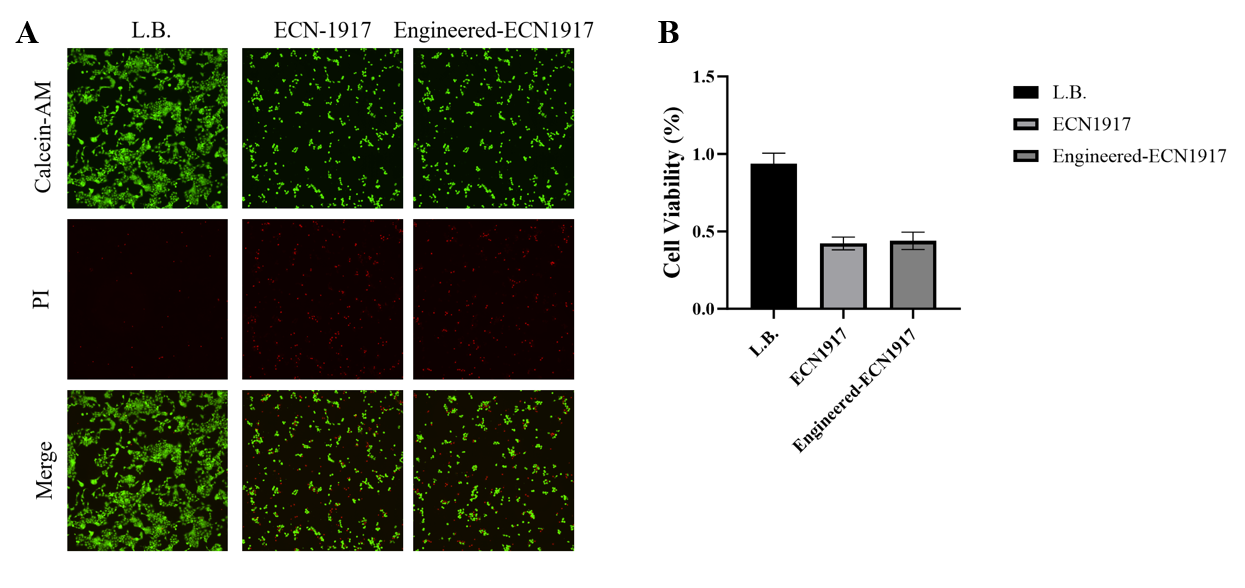
We measured relative viability values of 42.6 ± 4.1% for the EcN chassis and 44.5 ± 5.2% for engineered EcN, with no statistically significant difference between those bacterial groups. The medium-only group is higher in Fig. 5. A non-significant difference does not establish equivalence or safety; the low values relative to the medium-only group are a reason for caution and further controlled study.
5. Containment claim
We designed a bile-responsive Hok/Sok switch for containment. A greater-than-99.99% decline after bile removal remains an unverified claim in our engineering summary: the corresponding result figure, raw counts, starting denominator, detection limit, replicate record and escape-assay data are not yet available. We therefore cannot conclude that containment or zero escape has been demonstrated.
Overall interpretation
Our results support a limited in-vitro proof-of-concept: tetrathionate-associated reporter expression, a cross-induction signal with a Salmonella culture-filtrate proxy, lower crystal-violet-stained biofilm biomass in one assay, and no statistically significant difference between the two bacterial groups in the L-929 assay. These experiments do not establish rapid clinical diagnosis, pathogen-specific killing, protection of the native microbiome, host safety, or environmental containment.