
RNAt Model
Experimental Design
We developed an ordinary differential equation model incorporating temperature-dependent RNAt opening, BGL2 translation, mRNA decay, protein degradation, and cell-wall integrity, and simulated three RNAt designs with melting temperatures of 44.5°C, 39.0°C, and 36.5°C and a lethal temperature of 45.0°C.
Key Findings
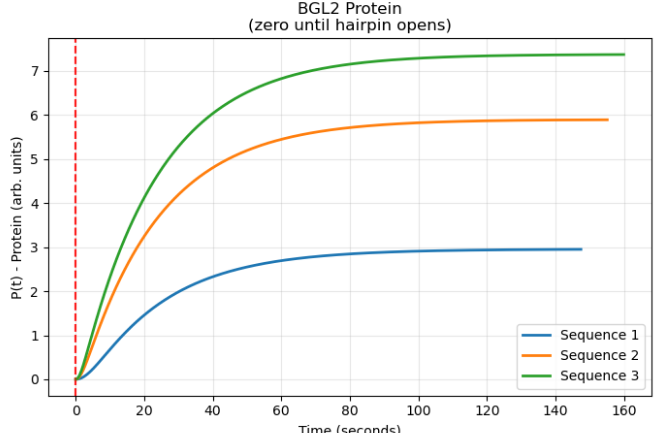
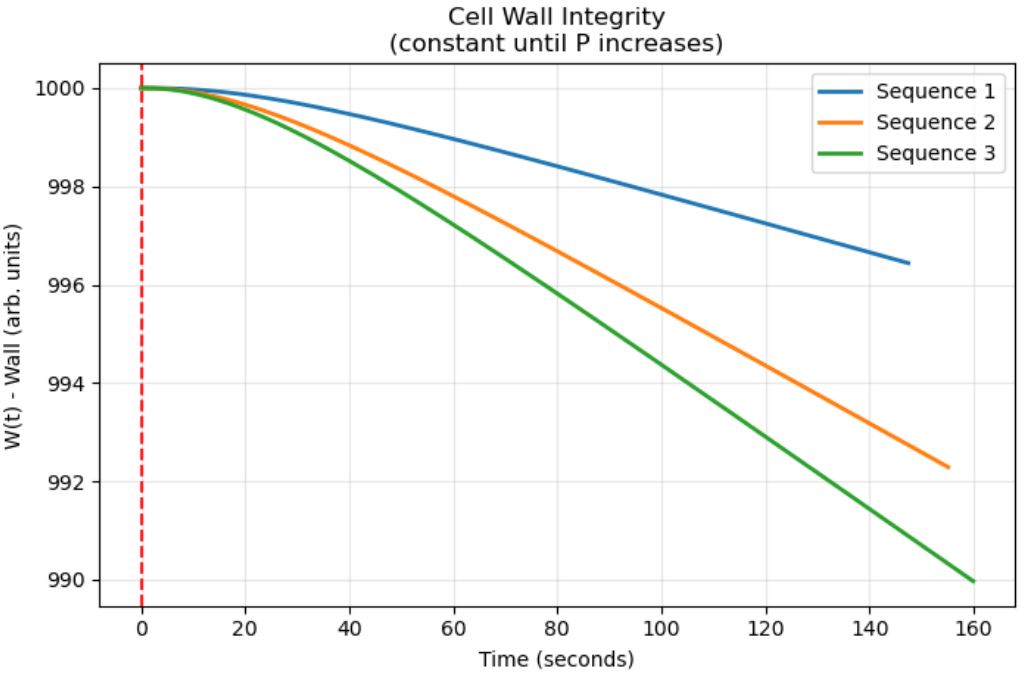
The model predicted that all three RNAt designs produced BGL2 before reaching 45°C. The 36.5°C design initiated translation earliest, producing the greatest amount of BGL2 protein and causing the greatest reduction in cell-wall integrity.
Implications
Based on these results, Sequence 3 (Tm = 36.5°C) was selected as the most promising RNAt design for experimental testing of heat-triggered BGL2 expression and yeast cell-wall degradation.
Problem Statement
S. cerevisiae can be genetically engineered to express BGL2, a glucanase capable of weakening the yeast cell wall and releasing TAG into the vegetarian burger. By placing BGL2 expression under the control of temperature-responsive RNA thermosensors, the system aims to initiate cell-wall degradation only when the yeast cell reaches the melting temperature of the selected RNAt sequence. The dry-lab team developed a model to evaluate how different thermosensor melting temperatures affect the timing and level of BGL2 production before the yeast cells reach their lethal temperature of 45°C.
Background
RNA thermometers/thermosensors (RNAts) are RNA sequences that offer control over the translation of mRNA sequences based on temperature. This is done by utilizing the structure of the sequence to produce a Boolean "switch," regulating translation by prohibiting it at select temperatures and allowing it at others. The lowest temperature at which the RNAt sequence unfolds and translation can occur is called the melting temperature (Tm).
Model Construction
Initial Conditions and Parameter Selection
The RNAt model begins by assuming we have pre-existing BGL2 mRNA in the yeast cell, so transcription is not included in the model itself. At the start of each simulation, the system contains 50 arbitrary units of BGL2 mRNA, no active ribosome complexes, no BGL2 protein, and a cell wall integrity value of 1000 arbitrary units.
The model uses a 313 amino acid BGL2 sequence[1] and an elongation rate of 9.5 aa/s[2], giving an elongation time of about 32.98s per full-length protein and an effective elongation constant of 0.0303 s-1. Translation initiation is capped at 0.2 s-1[3], ribosome-mRNA binding is 0.1 units·s-1, protein degradation is 0.043/3600 s-1[4], mRNA decay corresponds to a 20 min half-life[5], and wall degradation is modelled with a protein-dependent rate of 0.01 units·s-1.
Thermosensor Dynamics
Each RNAt is represented as a temperature-responsive hairpin that transitions from a closed state to an open state as the temperature of its surroundings approaches its melting temperature. For each RNAt sequence, the model tracks how four variables change from the RNA thermosensors' respective melting temperatures (Tm1 = 44.5°C, Tm2 = 39°C, Tm3 = 36.5°C) to 45°C over 420 seconds.
During heating, a sigmoidal melting function calculates the fraction of thermosensors that are open, f_open(T). This allows the model to represent gradual hairpin unfolding rather than an instantaneous switch between closed and open states. Thus, making the model more realistic biologically speaking.
Once the temperature-dependent opening (f_open(T)) is known, the model converts that structural state into an effective translation initiation rate, k_initeff(t), which scales with the fraction of RNAt that are open. When the hairpin is mostly closed, k_initeff(t) is close to zero, and ribosomes cannot efficiently initiate translation. As the temperature approaches and exceeds the Tm, initiation increases, and ribosomes begin translation. This creates the key coupling in the model: thermal unfolding of the RNAt directly controls the rate at which BGL2 protein can be synthesized.
ODE Framework
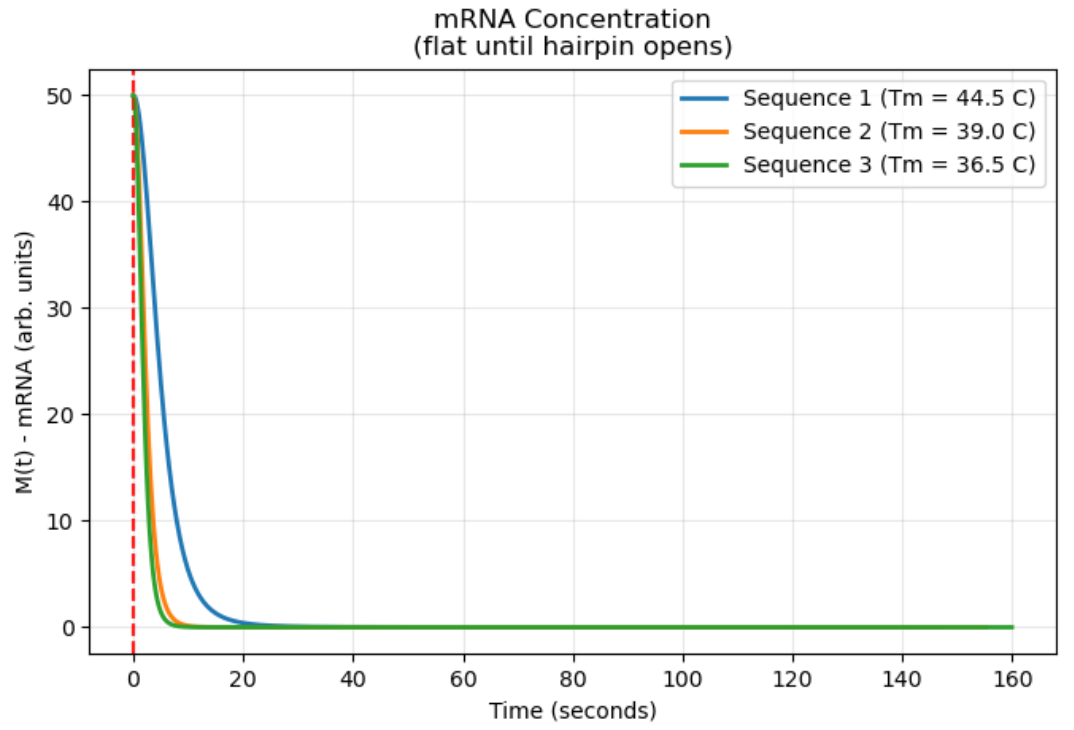
The ODE system tracks four variables: mRNA concentration M, active ribosome complexes R, BGL2 protein P, and cell wall integrity W. mRNA decreases by first-order decay and by ribosome-associated consumption; active ribosomes increase through temperature-gated initiation and decrease through exit; protein accumulates through elongation at a rate determined from the BGL2 length and ribosome elongation speed, and protein is removed by degradation. Cell wall integrity declines as a function of BGL2 accumulation, so the model connects translation output to cell wall integrity rather than stopping at protein synthesis alone.
Simulation Workflow
The simulation is run in two phases. In the first phase, before the RNAt mean first passage time is reached, the hairpin is treated as closed, and initiation is forced to zero. In the second phase, once the structure is assumed to open, the model integrates the coupled ODEs using a stiff solver and updates the initiation rate continuously with temperature. The run terminates when one of three events occurs: all ribosomes finish translation, the wall integrity reaches zero, or the culture reaches 45°C. This structure lets the model determine whether BGL2-mediated wall weakening can occur fast enough to matter biologically before heat stress becomes lethal.
Since the model is parameterized with the RNAt melting temperature and MFPT from design, it can compare different candidate sequences directly. The intended output is not just how long it takes for translation to occur, but whether the timing and magnitude of protein production are sufficient to reduce wall integrity before the lethal temperature is reached. In that sense, the model functions as a timing analysis for the thermosensor, linking RNA folding kinetics, translation kinetics, and wall degradation into one framework.
Results
Discussion
This preliminary model predicts that for each RNAt sequence tested (Tm1 = 44.5°C, Tm2 = 39.0°C, Tm3 = 36.5°C, referred to as Sequence 1, Sequence 2, and Sequence 3, respectively), the terminating event is the ribosomes completing translation of the mRNA sequence. This event occurs after 147.62s for Sequence 1, 155.34s for Sequence 2, and 160.01s for Sequence 3.
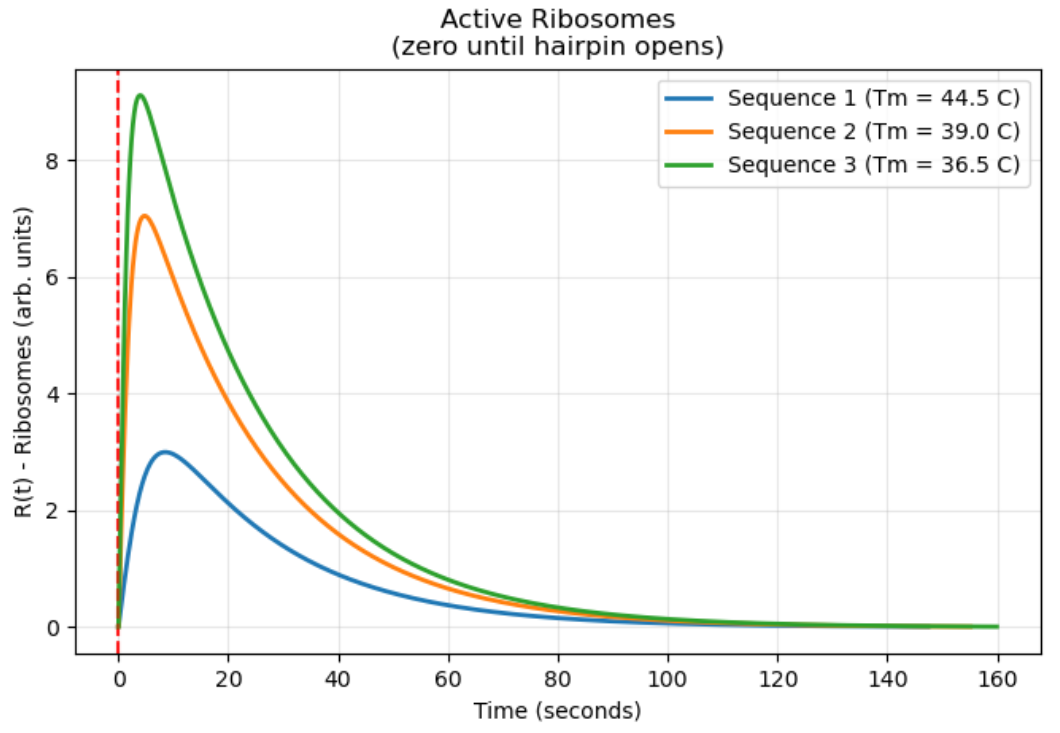
Based on the simulation, the active ribosomes have the earliest and highest peak in Sequence 3 at roughly 4s, followed by Sequence 2 at roughly 5s, and Sequence 1 at roughly 9s. This causes Sequence 3 to have the earliest and highest peak protein concentration after roughly 23s, followed by Sequence 2 after roughly 25s, and Sequence 3 after roughly 28s. The plateau in BGL2 protein is biologically reasonable because the protein is not expected to degrade substantially within the short simulation period; instead, it remains available to continue weakening the cell wall until rupture or loss of integrity occurs. This is related to the respective melting temperatures of each sequence, as the sequence with the highest melting temperature translates the greatest amount of BGL2 protein, thereby causing the greatest damage to the cell wall. This indicates that while all three sequences are capable of dissolving the cell wall, Sequence 3 degrades the wall with the greatest efficacy.
Validation
To validate the model's timescales, we compare the simulated ribosome completion time to published peptide‑chain elongation rates in Saccharomyces cerevisiae and a direct calculation for BGL2 (313 amino acids). The basic formula is: t_translation = (protein length in amino acids) / (elongation rate in aa·s-1).
Using the commonly cited value for fast, glucose‑grown yeast (≈9.3 aa·s-1) gives t_translation = 313 aa / 9.3 aa·s-1 ≈ 33.7s. Using the slower rate reported for acetate‑grown cells (≈5.5 aa·s-1) gives t_translation = 313 aa / 5.5 aa·s-1 ≈ 56.9s.
Thus, a biologically reasonable range for a single ribosome to synthesize a full BGL2 polypeptide is about 34–57 s, depending on growth conditions; a conservative working range of 30–60 seconds is appropriate for model comparisons. The simulation's active-ribosome curve is almost complete around 60 seconds, using a value of 9.5 aa/s; therefore, the time the bulk of translation ends is fairly close to this range and supports the model's chosen kinetic values.
Limitations & Next Steps
This is a preliminary model and a fairly new design framework. The wall-degradation term is phenomenological, so it captures the expected trend but not the full biochemistry of cell-wall remodelling, and the model is best treated as a useful first approximation rather than a final predictive system. It is strong for showing feasibility and timing, but it still needs reporter-based and kinetic experimental validation to become fully predictive.
References
- 1.BGL2 / YGR282C Overview. Yeast Genome Database, 2014, April 3.↗ link
- 2.Shah, P., Ding, Y., Niemczyk, M., Kudla, G., & Plotkin, J. B. Rate-limiting steps in yeast protein translation. Cell, 153(7), 1589–1601, 2013.↗ link
- 3.Chu, D., Kazana, E., Bellanger, N., Singh, T., Tuite, M. F., & von der Haar, T. Translation elongation can control translation initiation on eukaryotic mRNAs. The EMBO Journal, 33(1), 21–34, 2013.↗ link
- 4.Lahtvee, P.-J., Sánchez, B. J., Smialowska, A., Kasvandik, S., Elsemman, I. E., Gatto, F., & Nielsen, J. Absolute quantification of protein and mRNA abundances demonstrate variability in gene-specific translation efficiency in yeast. Cell Systems, 4(5), 495–504, 2017.↗ link
- 5.Milo, R. Median mRNA half life. Bionumbers, n.d..↗ link