
TAG Synthesis Kinetic Model
Experimental Design
Constructed a kinetic model in MATLAB SimBiology to simulate the impact of enzyme overexpression along the acyl-CoA pathways on triacylglycerol (TAG) production in Saccharomyces cerevisiae.
Key Findings
Overexpression of ACC1 and DGA1 increased TAG production in the model. TAG concentration was able to reach approximately 550 mM before plateauing as precursor metabolites become depleted.
Implications
Results suggest that ACC1 and DGA1 are promising targets for increasing TAG production. Further gains may require increasing precursor availability and reducing competing metabolic pathways.
Problem Statement
Kinetic modeling translates biological reaction rates into mathematical equations to simulate how concentrations evolve over time. Using MATLAB SimBiology, we integrate parameters from literature to map systems visually.
With our project, the model calculates the specific production rate of Triacylglycerols (TAG) in yeast. By simulating our chosen gene overexpressions, we can accurately predict our total lipid yields over time.
Background
Kinetic modelling predicts the dynamic changes in enzyme and substrate concentration over time within a system using known kinetic parameters and metabolite concentrations provided in literature. Using this approach, Kinetic Modelling can be an ideal tool for modelling how changes in the initial conditions of a system can alter metabolic pathways. A critical component of a kinetic model is that it measures changing metabolite concentrations over time, meaning that the simple Steady State Approximation is not applicable for this form of modelling.
Model Construction
| Gene | EC | Reaction | Km | vmax |
|---|---|---|---|---|
| GUT2 | 1.1.5.3 | G3P + ubiquinone → DHAP + ubiquinol | 2.5 mM | 0.305 mM/min |
| GPD1/2 | 1.1.1.8 | DHAP + NADH + H(+) → Gro-3P + NAD(+) | 0.54 mM | 3.07 mM/min |
| GPT2 | 2.3.1.15 | Gro-3P + acyl-CoA → LPA + CoA | 0.03 mM | 2.08 µM/min |
| SLC1 | 2.3.1.51 | LPA + acyl-CoA → PA + CoA | 0.0118 mM | 5.00 µM/min |
| PAH1 | 3.1.3.4 | PA + H2O → DAG + Pi | 0.05 mM | 0.067 mM/min |
| DGA1 (1st use) | 2.3.1.20 | DAG + acyl-CoA → TAG | 17 µM | 1.16 µM/min |
| DGA1 (2nd use) | 2.3.1.21 | Acyl-CoA + DAG → TAG + CoA | 17 µM | 1.16 µM/min |
| ACC1 | 6.4.1.2 | Acetyl-CoA + HCO3- + ATP → Malonyl-CoA + ADP + Pi | 0.14 mM | 1.73 mM/min |
| FAS1/2 | 2.3.1.86 | Malonyl-CoA + acetyl-CoA + NADPH → Acyl-CoA | 18 µM | 0.1336 mM/min |
| ARE1/2 | 2.3.1.26 | Acyl-CoA + sterol → Steryl ester + CoA | 0.069 mM | 0.00268 mM/min |
| OLE1 | 1.14.19.1 | palmitoyl-CoA → Acyl-CoA | 10.5 µM | 0.00777 mM/min |
| OLE1 | 1.14.19.2 | stearoyl-CoA → Acyl-CoA | 10.5 µM | 0.00777 mM/min |
| Metabolite | Acronym in model |
|---|---|
| Glyceraldehyde 3-phosphate | G3P |
| Dihydroxyacetone phosphate | DHAP |
| Nicotinamide adenine dinucleotide | NAD+ |
| Glycerol 3-phosphate | Gro-3P |
| Coenzyme A | CoA |
| Lysophosphatidic acid | LPA |
| Phosphatidic acid | PA |
| Diacylglycerol | DAG |
| Inorganic phosphate | Pi |
| Triacylglycerol | TAG |
| Adenosine tri-phosphate | ATP |
| Adenosine di-phosphate | ADP |
| Nicotinamide adenine dinucleotide phosphate | NADPH |
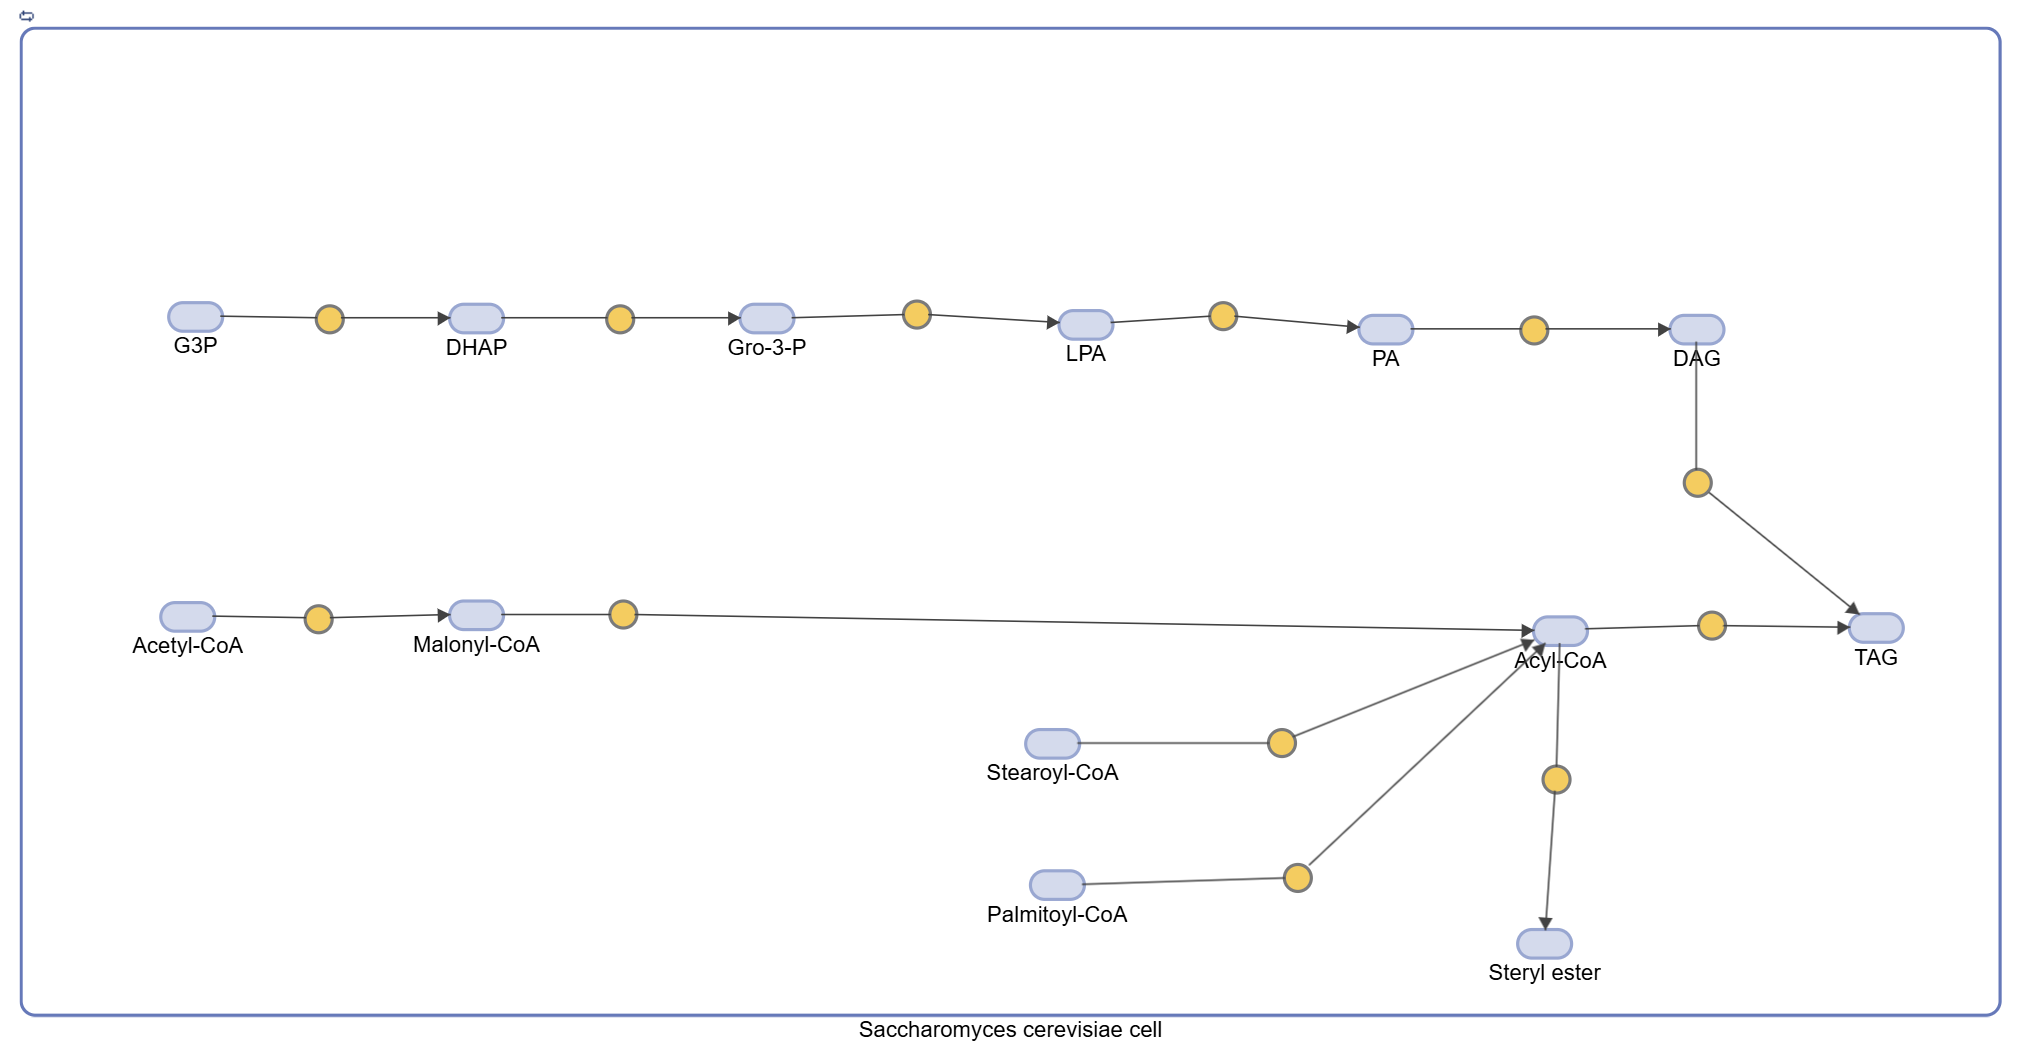
The Kinetic model depicted in the diagram above represents the complete Triacylglycerate (TAG) synthesis pathway in S. cerevisiae. Of relevance to this model are the ACC1 and DGA1 genes, which catalyze the reactions of Acetyl-CoA → Malonyl-CoA and DAG + Acyl-CoA → TAG respectively. Using SimBiology, we modelled the overexpression of these genes.
Model Assumptions
Due to a limited availability of kinetic parameters for the TAG synthesis pathway in S. cerevisiae in literature, various kinetic parameters for the metabolic pathway were cited from alternative organisms. In a case where borrowing a gene's kinetic parameters from another organism was required, we prioritized any genes found in similar fungi. When this was not possible, a reasonable estimation served as a placeholder value in the model. To construct the Kinetic Model, the following assumptions were made:
- Km of the GUT2 gene in S. cerevisiae was not available in literature. Thus, the Km of the GUT2 gene in Rattus norvegicus was used in the Kinetic Model.
- Km of the gene SLC1 was also not provided in literature. As a substitute, Km of SLC1 in Mycobacterium tuberculosis was supplemented into the model.
- Km of ACC1 in S. cerevisiae was not provided in literature. This was substituted with the Km of ACC1 in E. coli for the model.
- Finally, Km of OLE1 in S. cerevisiae was not available in literature. Thus, Km in Rattus norvegicus was used to substitute it within the model.
- If any reaction rate was not explicitly stated in literature, the reaction was assumed to follow the Michaelis-Menten law of enzyme-catalyzed reactions and be irreversible.
- The products, stearoyl-CoA and palmitoyl-CoA, are assumed to be acyl-CoA species, as both compounds are fatty acyl–coenzyme A thioesters.
Results
Discussion
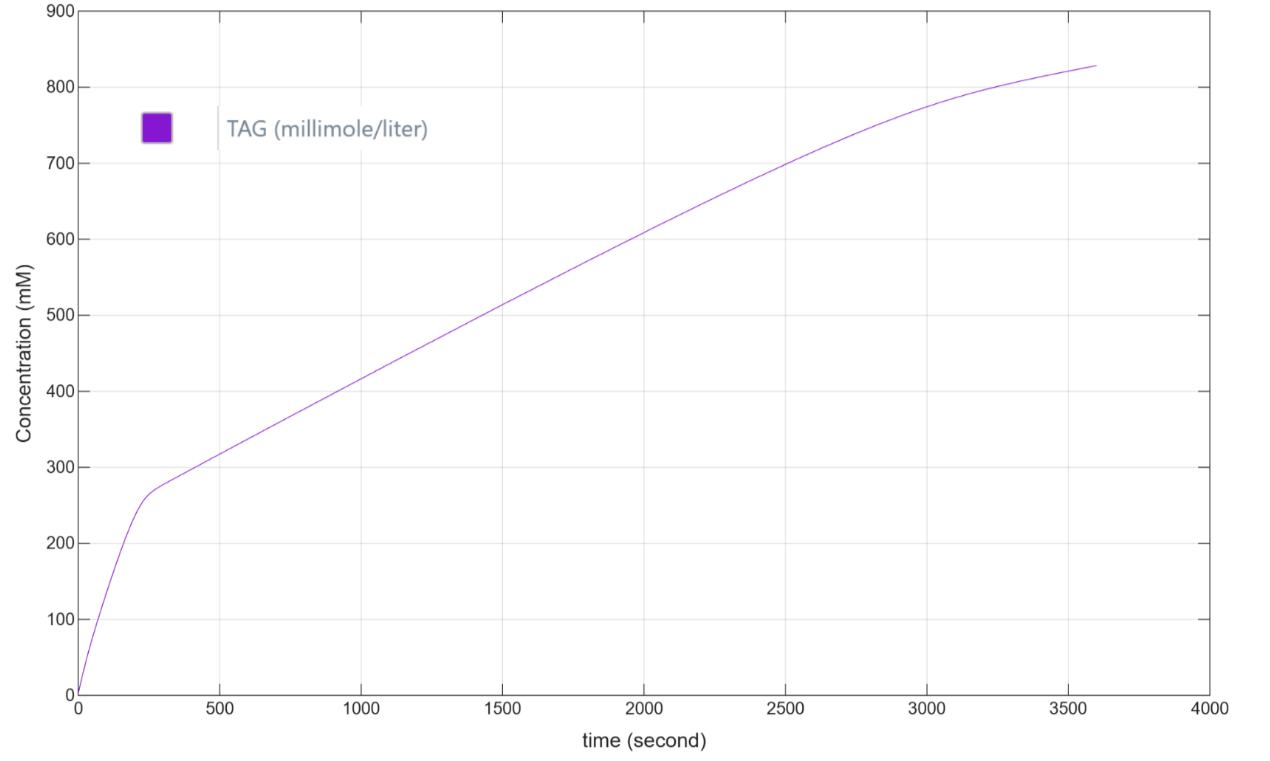
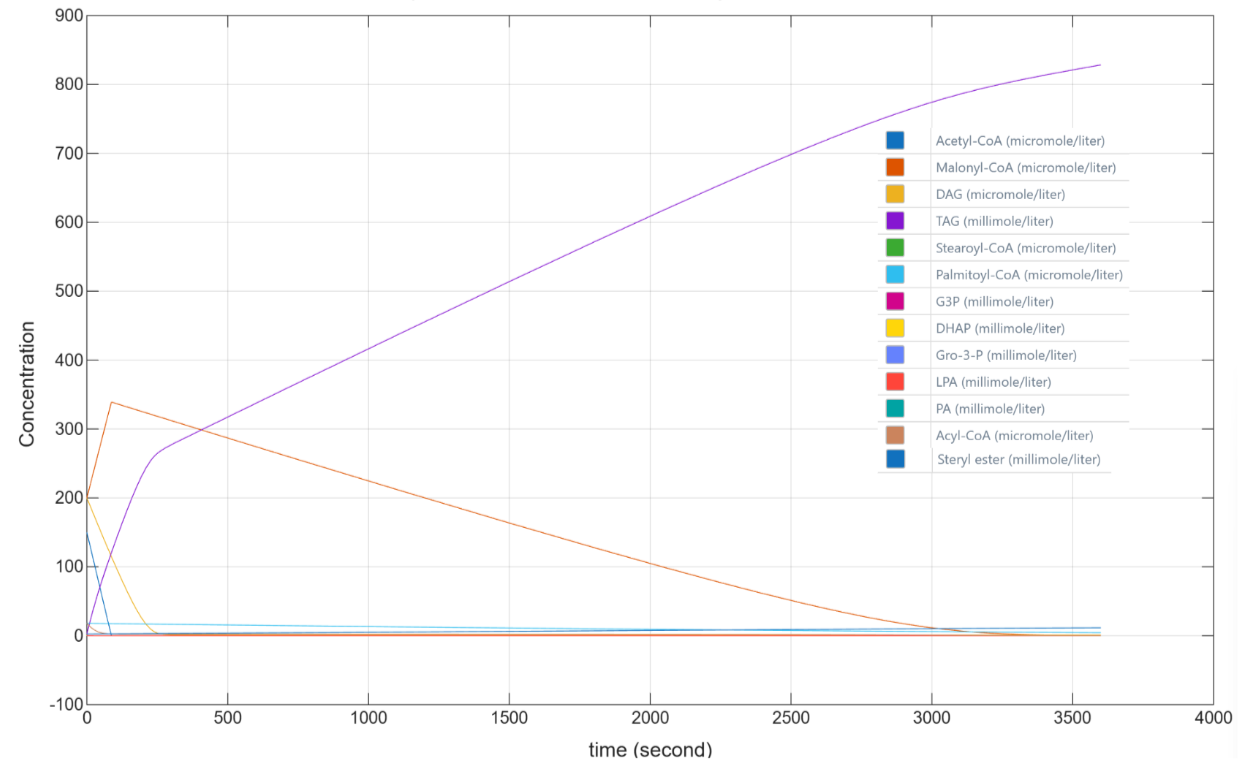
Overexpressing key enzymes in this metabolic pathway successfully drives triacylglycerol (TAG) production by eliminating internal bottlenecks. As shown by the steady upward trend of the purple curve representing TAG. The simulation shows a prolonged phase of constant linear accumulation up to 3300 seconds, and a final plateau where total TAG concentration caps out at approximately 560 mM.
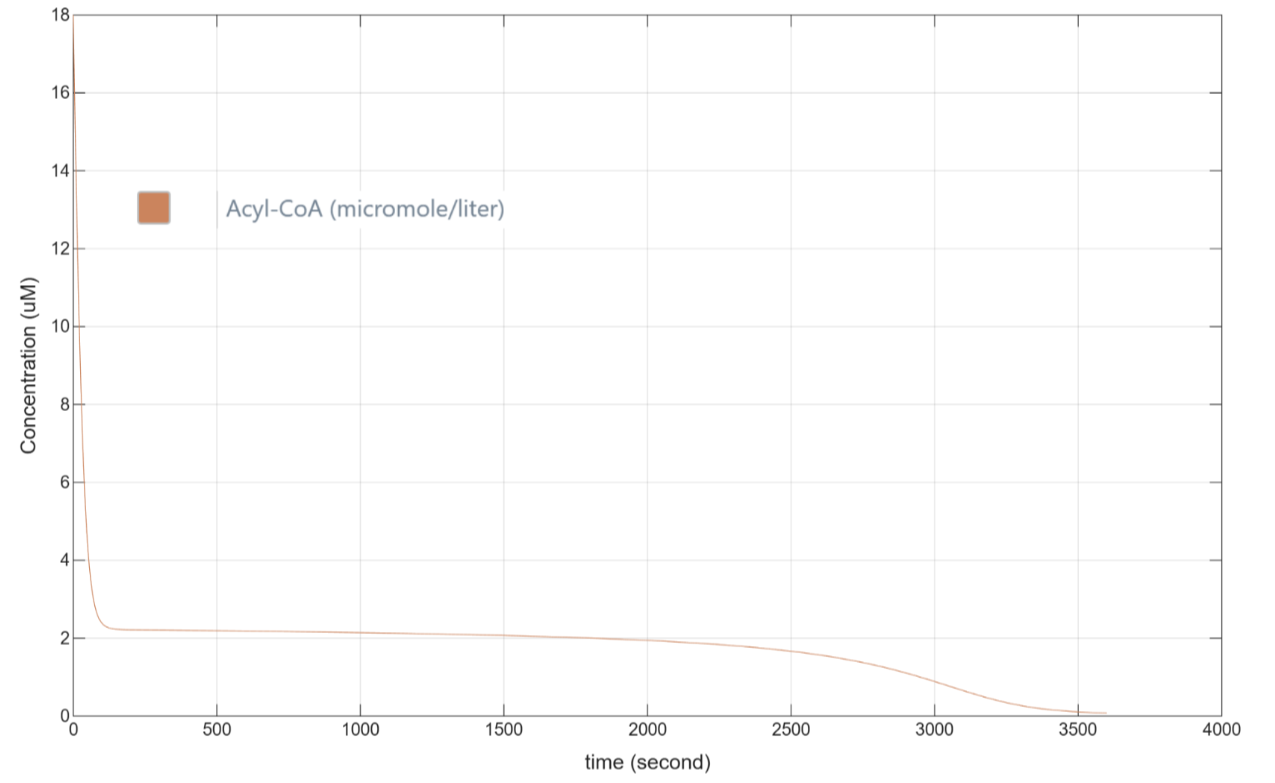
This plateau reveals a bottleneck in the current model setup. TAG synthesis stops increasing around 55 minutes not because of enzyme performance limits, but because the primary starting substrates are exhausted. Ultimately, these results show that while overexpressing these genes maximizes catalytic throughput, total TAG yield becomes limited by precursor substrates. In a living yeast cell, achieving this high theoretical storage capacity would depend on a continuous feed of starting nutrients, sufficient energy and storage capacity.
Validation
The overall trend predicted by the kinetic model is supported by experimental studies in S. cerevisiae. In particular, Ferreira et al. engineered S. cerevisiae using a "push-and-pull" strategy that increased precursor formation through a deregulated ACC1 while increasing conversion toward TAG through DGA1 and PAH1 overexpression. This combination produced approximately 129 mg TAG/g cell dry weight, representing more than a ten-fold increase compared with the reference strain[1].
Experimental evidence also supports the individual importance of DGA1. Kamisaka et al. found that DGA1 overexpression significantly increased lipid accumulation in S. cerevisiae, with TAG becoming the most abundant lipid under the tested engineered conditions. A later study similarly identified increased Acc1 activity and Dga1 overexpression as important modifications for achieving high TAG accumulation in engineered S. cerevisiae[2].
Together, these studies support the main behaviour observed in our simulation: increasing activity at the beginning of fatty-acid synthesis through ACC1 and increasing the final conversion of DAG to TAG through DGA1 can redirect metabolism toward greater TAG accumulation. However, the literature only validates the direction of the model prediction. The predicted concentration of approximately 560 mM and the time required to reach the plateau were not directly validated against experimental measurements.
Limitations & Next Steps
A major structural limitation of the current model lies in how input substrates are defined. The model treats the precursor metabolites (e.g., Acyl-CoA, G3P) as depleting state variables in a closed batch system rather than buffered, steady-state inputs maintained by cellular metabolism. In living S. cerevisiae, these substrates are continuously produced and buffered through cell function. Since the current model relies on substrate depletion to slow reaction rates and reach a final output, the calculated TAG yield is strongly dependent on initial precursor concentrations rather than the capacity of the cell.
Another major limitation is the lack of S. cerevisiae-specific kinetic parameters. As mentioned under Model Assumptions, several values were taken from other organisms. The model also simplifies reactions using irreversible Michaelis-Menten kinetics and does not fully account for feedback regulation, competing pathways, cell growth, or continuous nutrient uptake.
In addition, the current model focuses only on the kinetics of the selected TAG synthesis pathway and does not account for metabolic flux across the broader yeast metabolic network. Future work could incorporate Flux Balance Analysis (FBA) to identify how gene overexpression affects flux distribution through competing pathways and determine whether sufficient precursor flux is available for TAG synthesis. Combining FBA with the kinetic model could provide a more complete picture of both pathway-level flux and metabolite concentration changes over time.
Future work should replace cross-species parameters with yeast-specific values and perform sensitivity analysis to determine which parameters most strongly affect TAG production. The kinetic and FBA models could also be integrated so that FBA-derived flux constraints inform reaction rates in the kinetic model. Finally, experimental TAG measurements from engineered yeast could be compared with both models to calibrate their predictions and improve their biological accuracy.
References
- 1.Ferreira, R., Teixeira, P. G., Gossing, M., David, F., Siewers, V., & Nielsen, J. Metabolic engineering of saccharomyces cerevisiae for overproduction of triacylglycerols. Metabolic Engineering Communications, 6, 22–27, 2018.↗ link
- 2.Kamisaka, Y., Tomita, N., Kimura, K., Kainou, K., & Uemura, H. DGA1 (diacylglycerol acyltransferase gene) overexpression and leucine biosynthesis significantly increase lipid accumulation in the Δsnf2 disruptant of Saccharomyces cerevisiae. Biochemical Journal, 408(1), 61–68, 2007.↗ link