To validate the performance of the protein post-mutation, molecular docking was conducted using
the simulated structures of both pre- and post-mutation AraC proteins with the araBAD promoter
at positions (-144, -100) (Figure 8). Similarly, docking was performed using the simulated
structures of pre- and post-mutation TetR proteins with specific sites on the tetracycline
regulatory promoter (Figure 9). In addition, we also use their respective repressors for
molecular docking, such as AraC and arabinose(Figure 10), TetR and Tetracycline(Figure 11). The
results showed that The mutant has lower docking parameters for DNA compared to the wild type
and higher binding free energy for its deterrents. This suggests a tighter binding to DNA and a
lower tendency to bind to its deterrents. This suggests a theoretical reduction in manipulator
leakage and a smoothing of the change curve in the concentration of deterrents required for
switching on, increasing its tunability. A comparison revealed a shift in the binding position
of AraC post-mutation, although the movement was minor and is anticipated not to impact the
actual effect. This confirms the effectiveness of the model, offering a rapid and efficient
method to predict and improve DNA-binding proteins. Detailed docking data has been saved in the
supplementary materials.
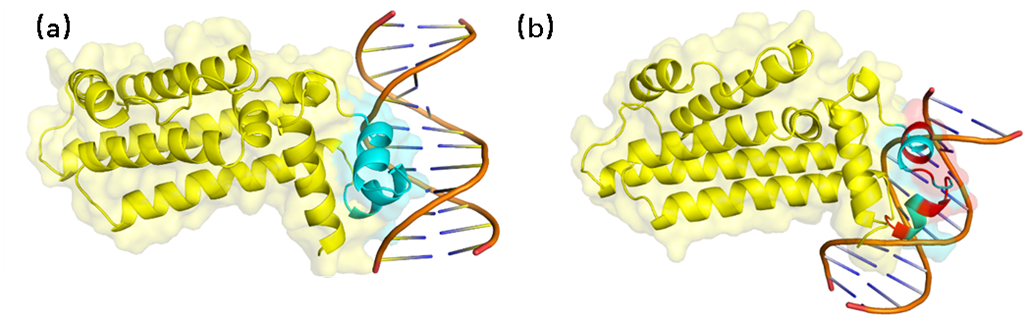
AraC molecular docking with DNA. (a) AraC and DNA docking results before mutation (b) AraC and
DNA docking results after mutation. The blue part is the DNA-binding site of the protein, the
yellow part is the rest of the structure, and the red part represents
the amino acid after the mutation.
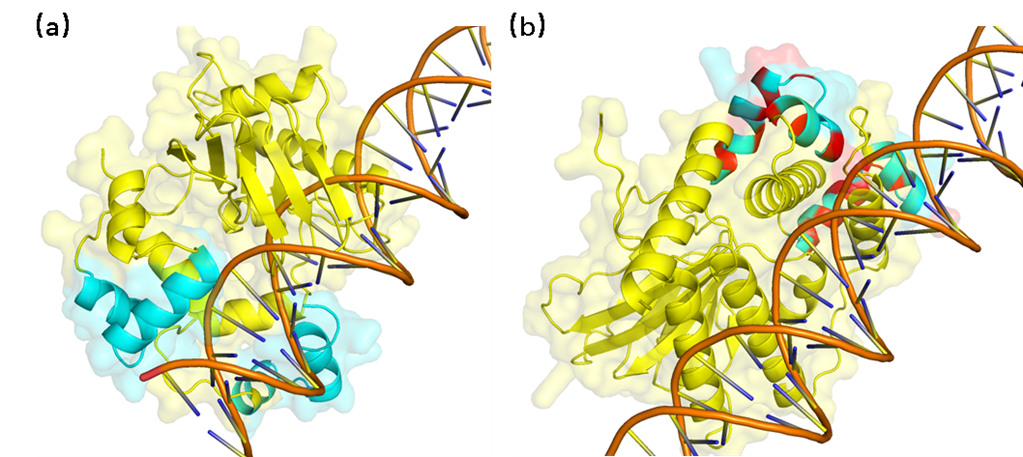
TetR molecular docking with DNA. (a) TetR and DNA docking results before mutation (b) TetR and
DNA docking results after mutation. The blue part is the DNA-binding site of the protein, the
yellow part is the rest of the structure, and the red part represents
the amino acid after the mutation.
|
Docking Score |
Confidence Score |
Ligand rmsd (Å) |
| AraC---DNA |
-212.02 |
0.7756 |
93.36 |
| TetR---DNA |
-214.65 |
0.7847 |
45.55 |
| AraCpro---DNA |
-222.48 |
0.8099 |
97.96 |
| TetRpro---DNA |
273.88 |
0.9226 |
95.74 |
Docking data :Docking Score: The docking energy scores.. Confidence Score:Credibility of
docking.
Ligand rmsd (Å): The ligand RMSDs from the input structures or modeled structures by homology
modeling.
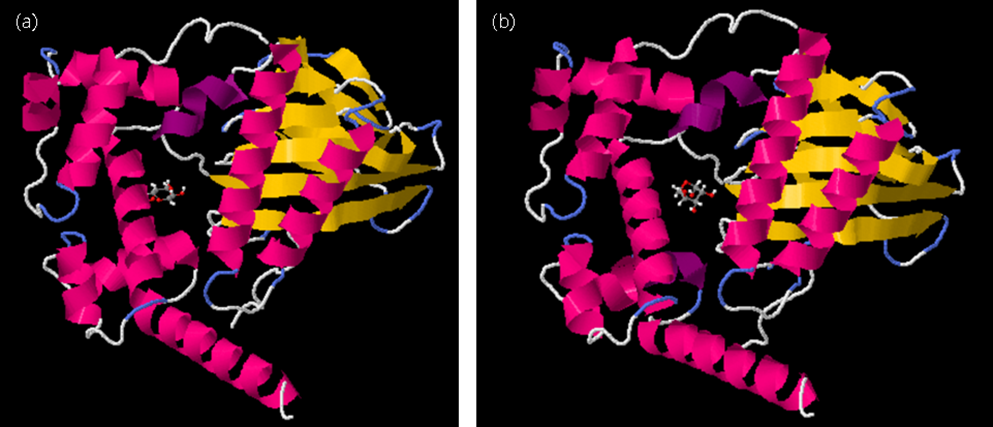
AraC molecular docking with arabinose. (a) AraC and arabinose docking results before mutation
(b) AraC and arabinose docking results after mutation.
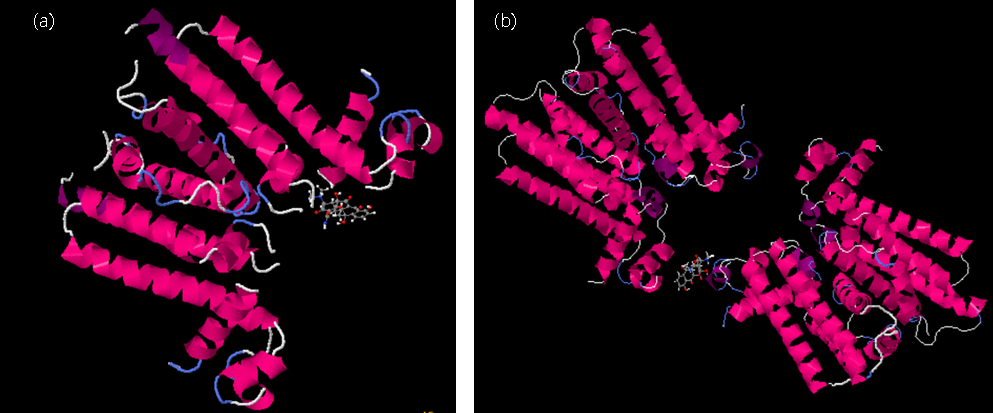
TetR molecular docking with tetracycline. (a) TetR and tetracycline docking results before
mutation (b) TetR and tetracycline docking results after mutation.
|
Estimated ΔG (kcal/mol) |
Confidence Score |
| AraC---arabinose |
-6.79 |
-1318.70 |
| TetR---tetracycline |
-7.70 |
-2811.57 |
| AraCpro---arabinose |
-6.27 |
-1305.61 |
| TetRpro---tetracycline |
-7.45 |
-3908.49 |
Docking data:Estimated ΔG Predicted binding free energy. FullFitness Usually used to describe
the overall interaction energy between two molecules, TetRpro because it is docked using the
tetramer model, FullFitness may be large.