

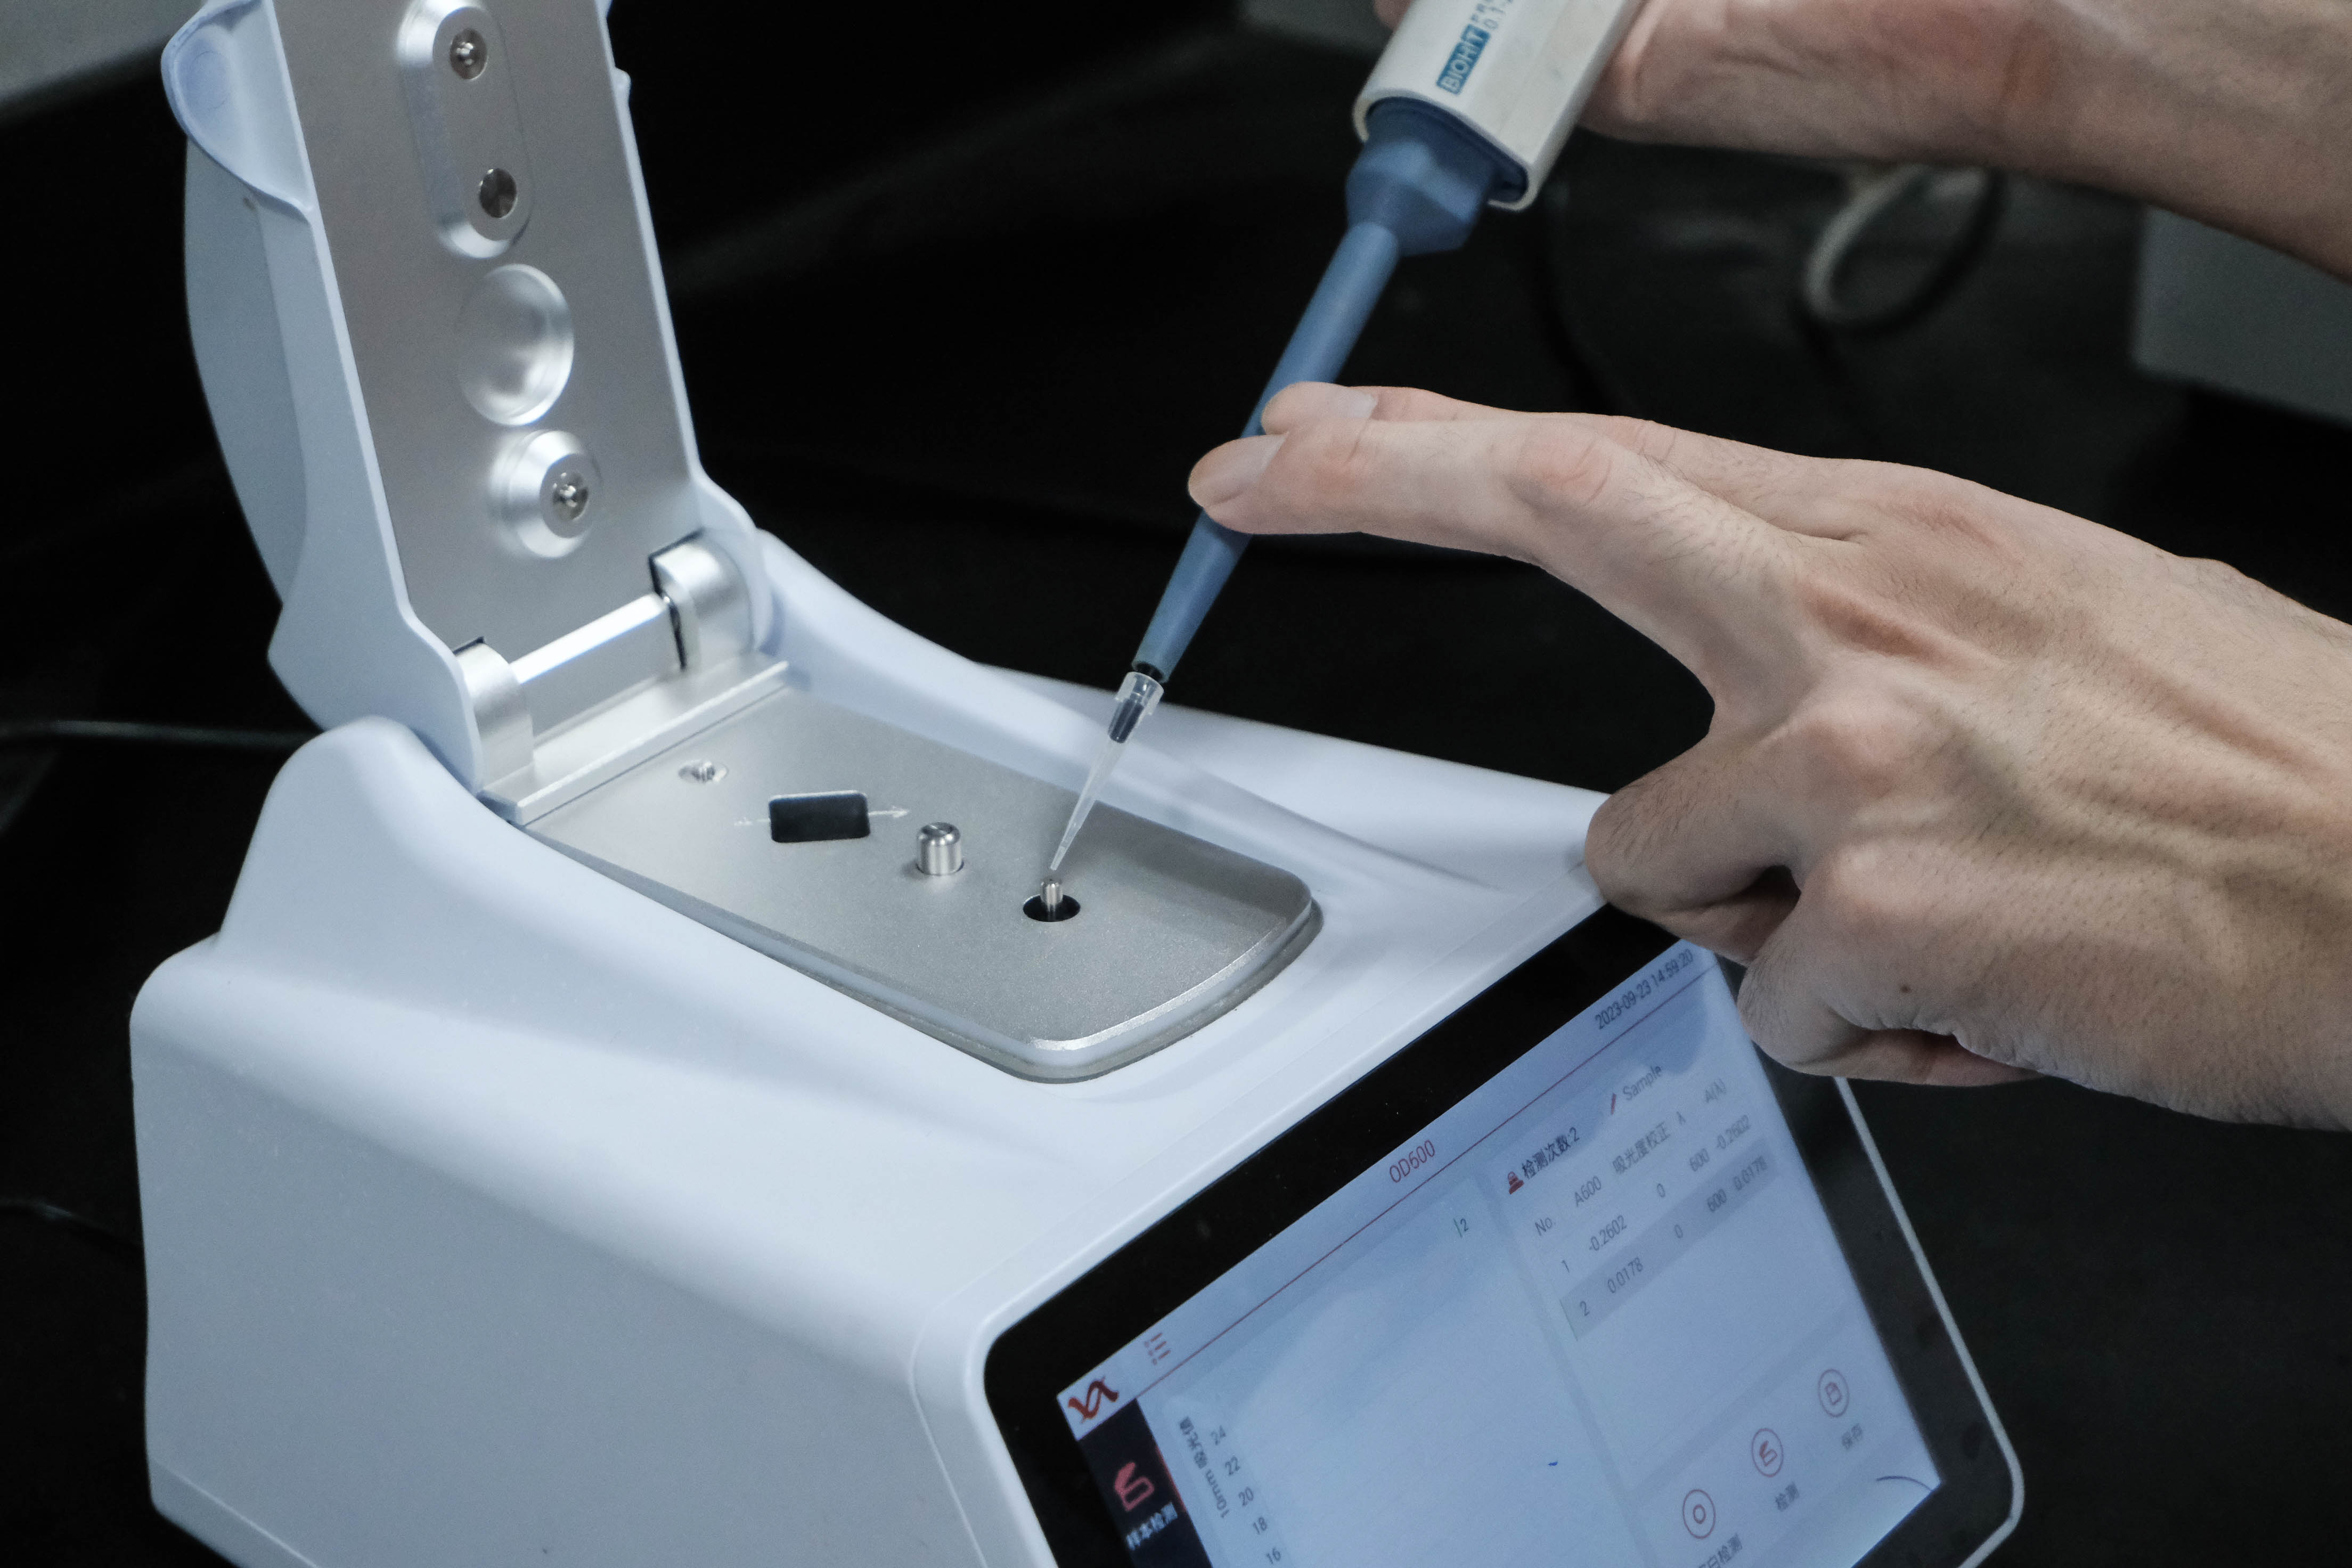


Figure S1. Optimization of the measurement signal-to-noise ratio of eGFP wavelengths. An optimal combination of excitation and emission wavelengths (Ex = 482 nm / Em = 524) was obtained and applied for subsequent detection by the spectral optimization wizard in SoftMax Pro software.

Figure S2. The growth curves of Escherichia coli. (A)Under the different concentration of naringenin. (B) Under the different concentration of liquiritigenin. Concentrations of both less than 1 mM barely affect bacterial growth. But the concentration of both at 2.0 mM and 3.0mM began to affect the normal growth of bacteria.

Figure S3. (A) 3D structure of naringenin. (B) 3D structure of and liquiritigenin.

Figure S4. Structure prediction and analysis of FdeR. (A) 3D structure of FdeR predicted by AlphaFold2. (B) pLDDT is a scoring system that measures the confidence of a predicted protein structure. It stands for per-residue lDDT, where lDDT is a metric that compares the local distances between two structures. pLDDT assigns a score between 0 and 100 to each residue in the predicted structure, based on how well it matches the reference structure. A higher score means a higher confidence in the prediction. The average pLDDT score across all residues indicates the overall confidence for the whole protein chain. (C) The best conformation of FdeR and liquiritigenin. (D) Hydrophobicity of binding area. (E) Binding energy and ranking of FdeR and liquiritigenin.

Figure S5. FdeR-promoter docking.(A) The structure of the P22 constitutive promoter modeled by Discovery Studio. (B) Docking results show relative positions between them. (C) Docking results including ranking and energy. (D) Relationships between frequency and scoring energy.

Figure S6. Flow cytometry analysis and gating strategy for E. coli BL21 control cells. (A) Cultures of E. coli BL21 transformed with plasmids containing eGFP reporter (Positive control) was analyzed in a FCS-A vs. FITC-A scatter plot and a postive fluorescence gate (GFP Pos.) was delimitated (94.2%). (B) The GFP Pos. gate(FITC-A > 3.6×10³ ) was observed in an Events vs. FITC-A histogram plot for better visualization. (C) Cultures of E. coli BL21 with empty pQE-80L plasmids (Negative control) was analyzed in a FCS-A vs. FITC-A scatter plot and a negative fluorescence gate (GFP Neg.) was delimitated (99.7%). (D) The GFP Neg. gate(FITC-A < 3 ×10³) was observed in an Events vs. FITC-A histogram plot for better visualization.
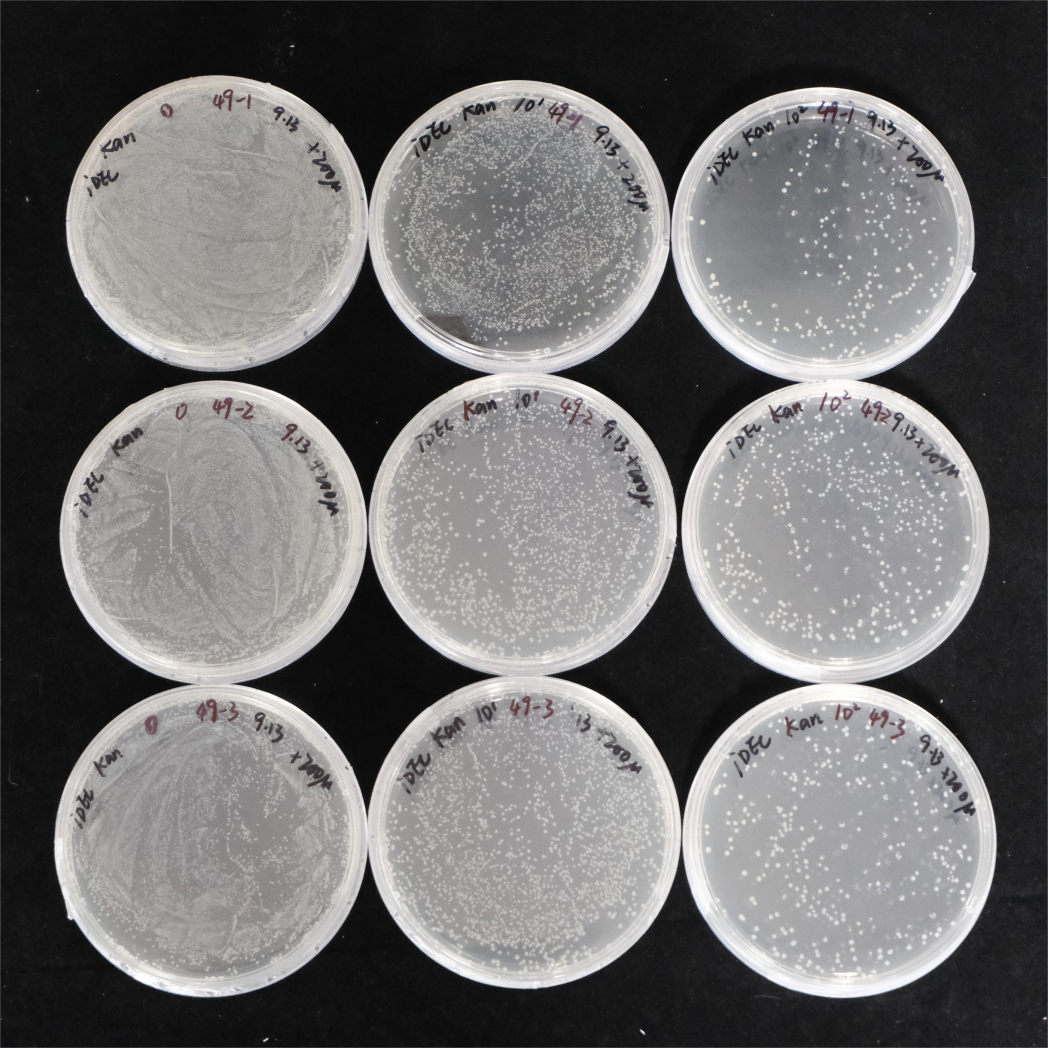
Figure S7. Dilution spread of cell suspension obtained from FACS.Samples were diluted 0, 10, 100-fold and spread on plates to isolate single colonies, each representing a mutant, for subsequent 96-well plates screening.
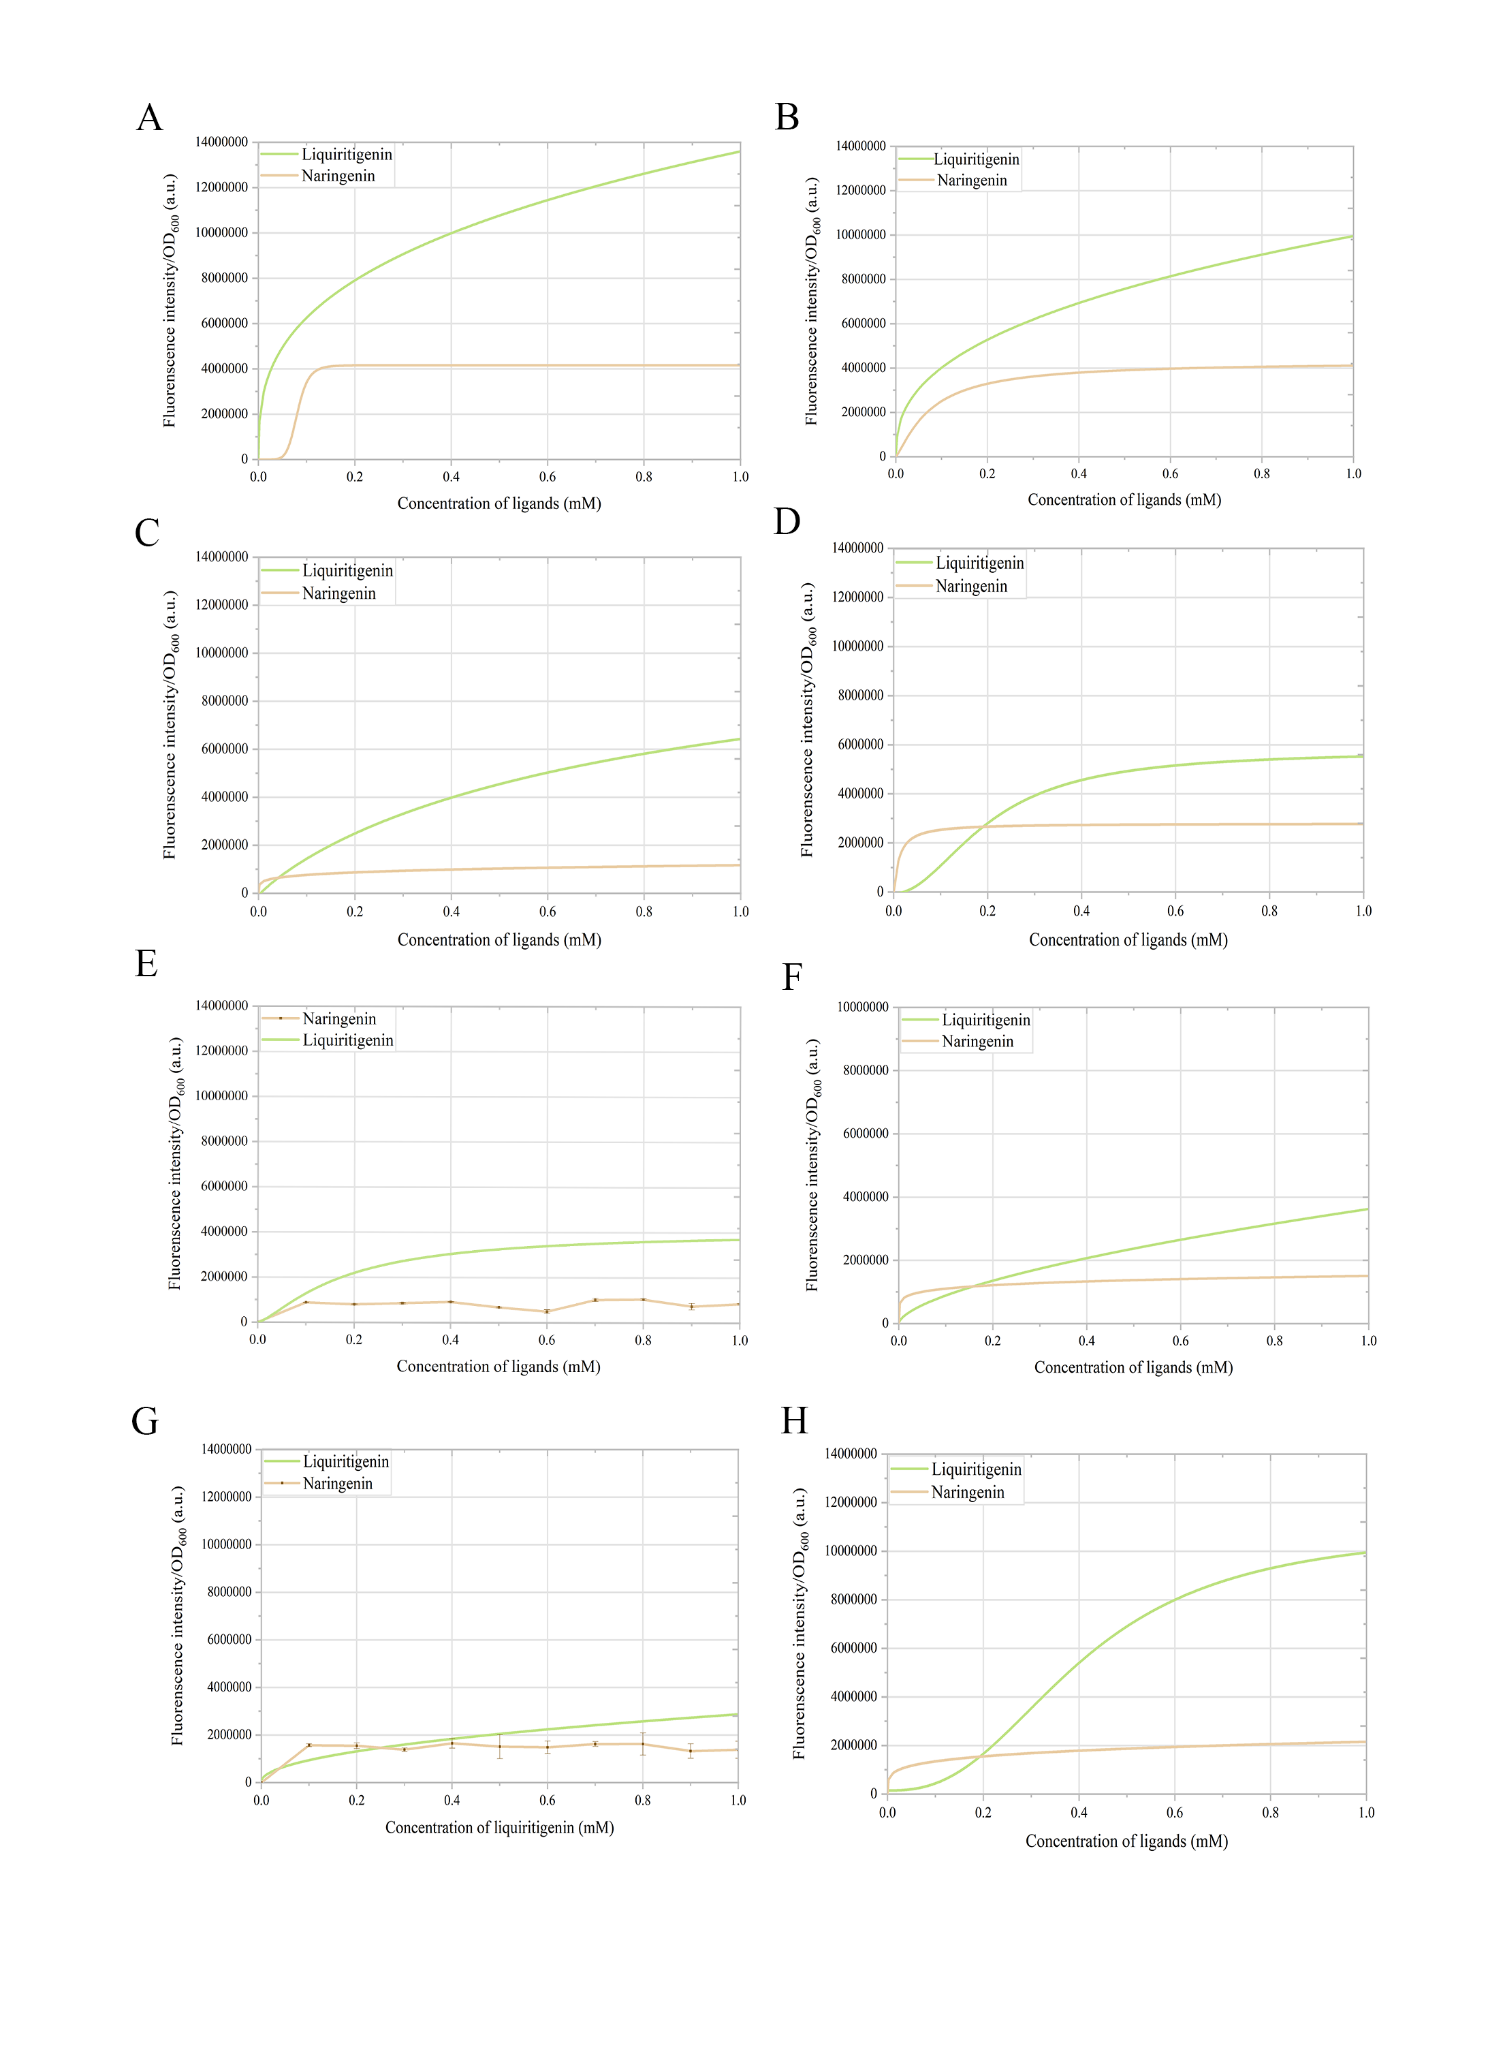
Figure S8. Response curves of mutants to different concentrations of liquiritigenin and naringenin. (A) Mut_49_70. (B) Mut_49_39. (C) Mut_49_36. (D) Mut_49_18. (E) Mut_49_92. The response curve for naringenin is not applicable. (F) Mut_49_49. (G) Mut_49_66. The response curve for naringenin is not applicable. (H) Mut_49_11.
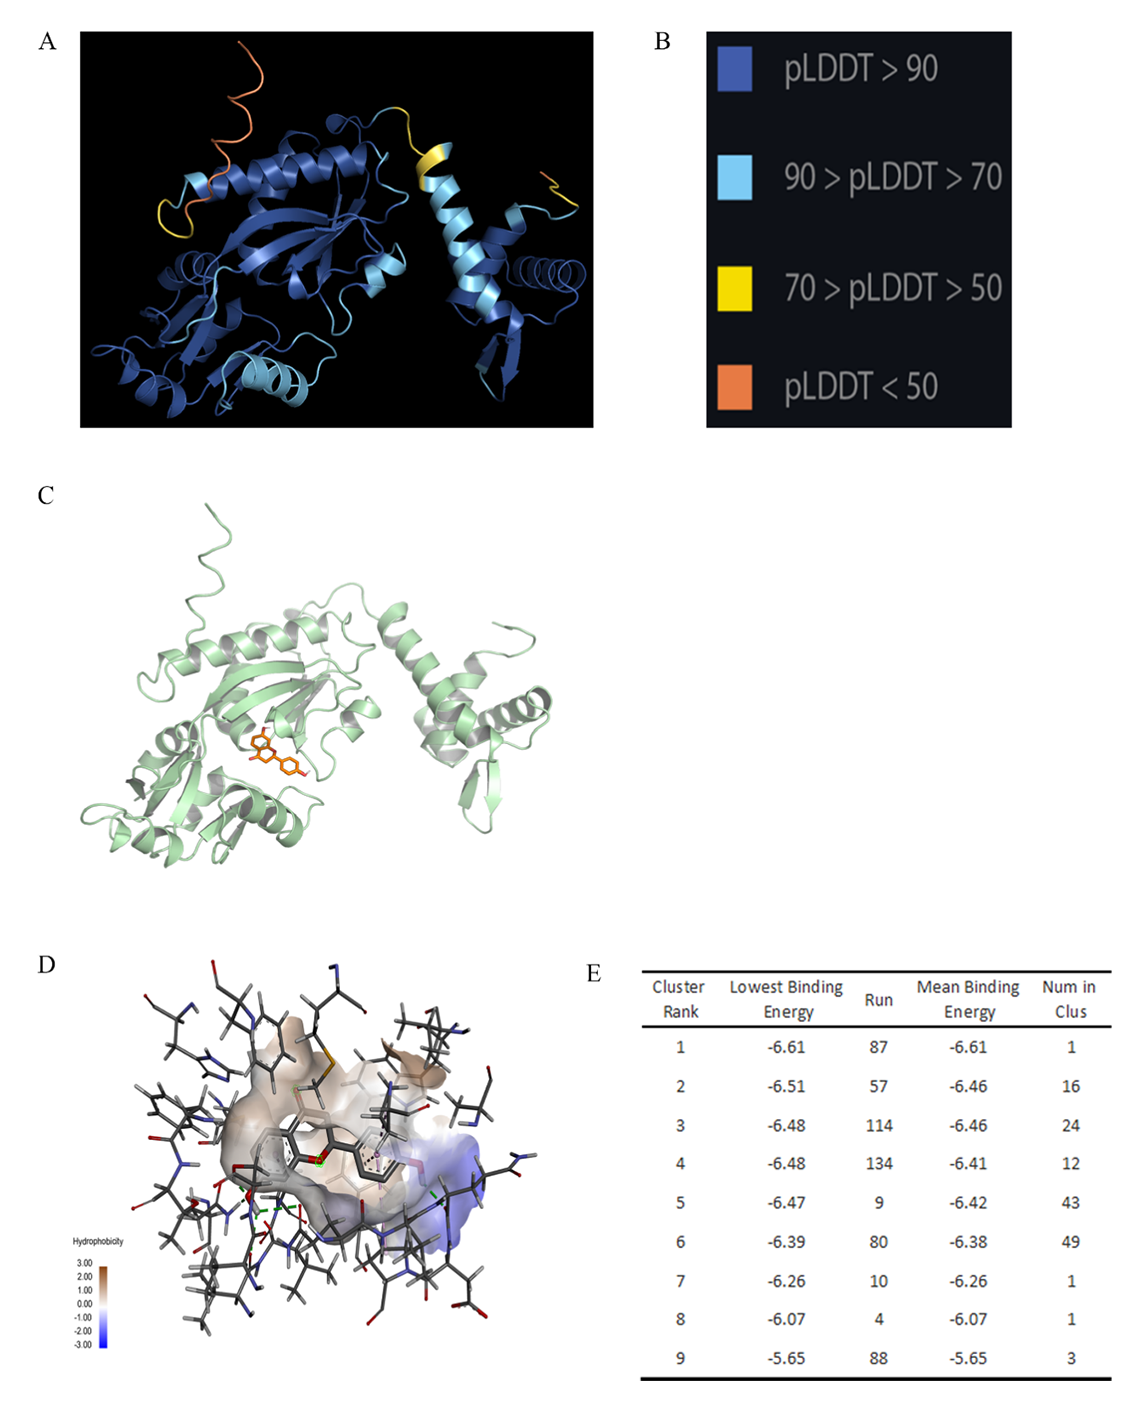
Figure S9. Structure prediction and analysis of Mut_49. (A) 3D structure of mutant49 predicted by AlphaFold2. (B) pLDDT scoring system. (C) The best conformation of Mut_49 and liquiritigenin. (D) Hydrophobicity of binding area. (E) Binding energy and ranking of mutant 49 and liquiritigenin.
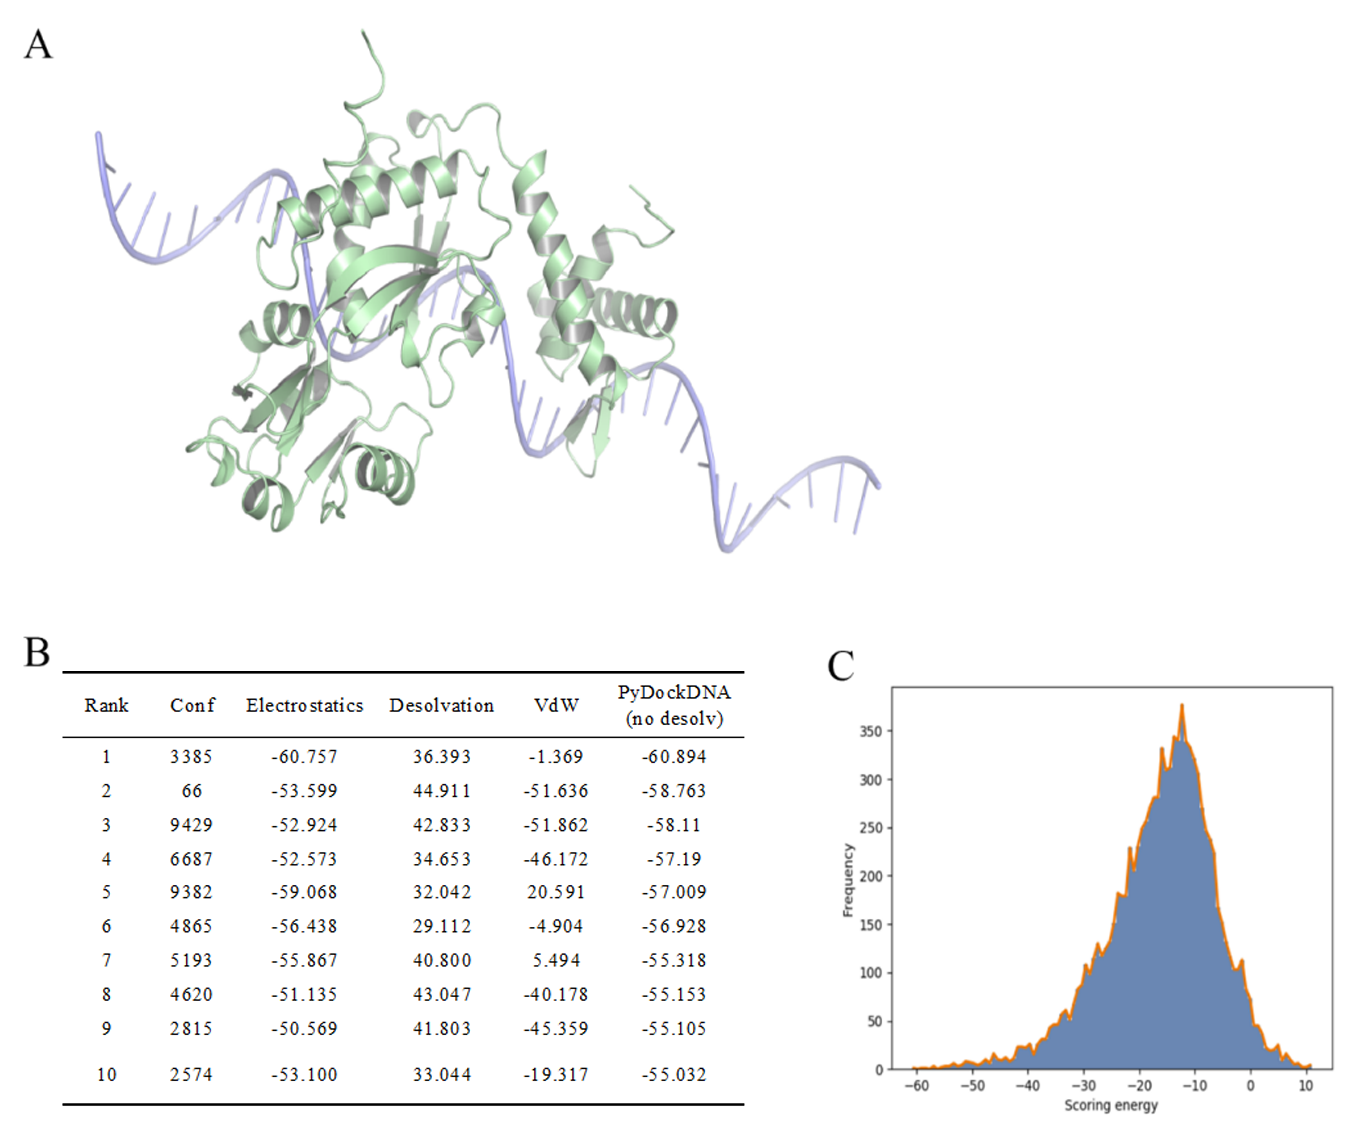
Figure S10. Mut_49-promoter docking. (A) Docking results show relative positions between them. (B) Docking results including ranking and energy. (C) Relationships between frequency and scoring energy.
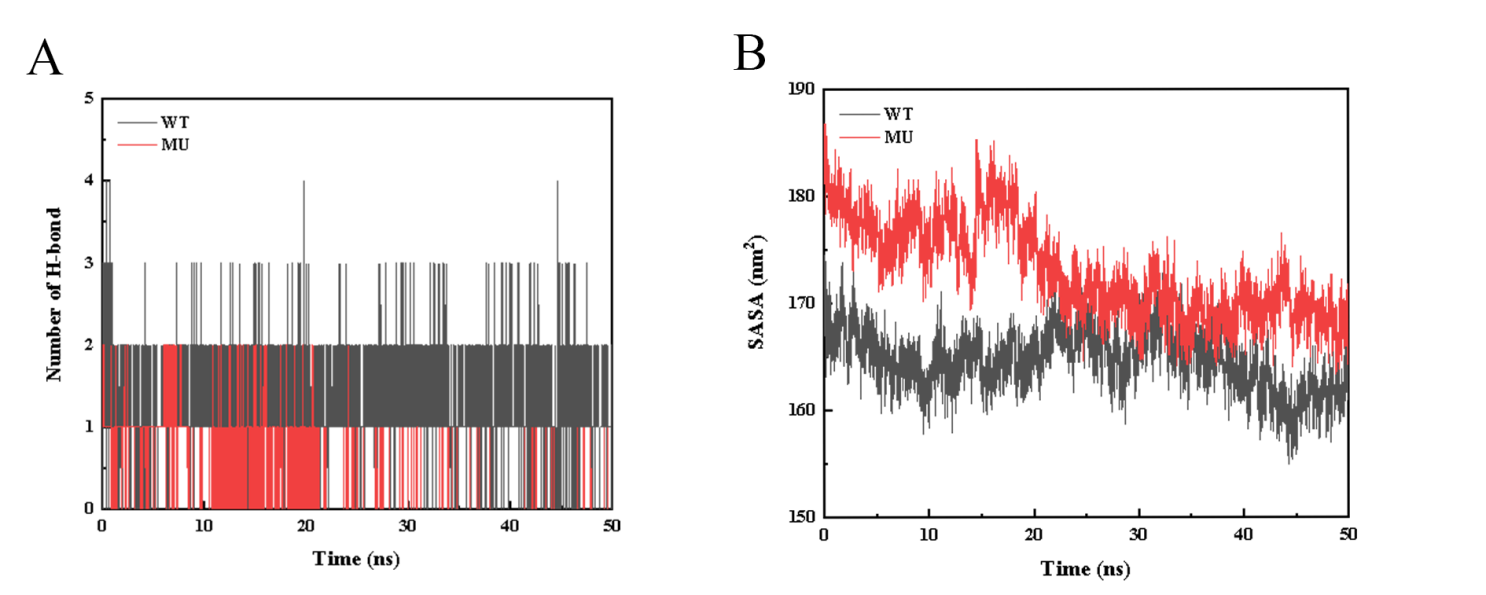
Figure S11. Molecular dynamics trajectory analysis of WT and Mut_49. WT stands for FdeR, MU stands for Mut_49. (A) The number of hydrogen bonds during the protein-ligand complex simulation process (The average number of hydrogen bonds for WT and MU protein with the ligand are 1.23 and 0.34 respectively). (B) The SASA curve of the protein during the protein-ligand complex simulation process (The solvent accessible surface area (SASA) is calculated by the van der Waals interaction between the solute and the solvent molecules. The SASA of the protein decreases as the protein density increases, so the change of SASA can predict the change of protein structure. In the figure, the SASA values of the protein in all the complex simulation processes show a downward trend, indicating that the protein density structure increases, and the density change of MU protein is greater than that of WT protein).
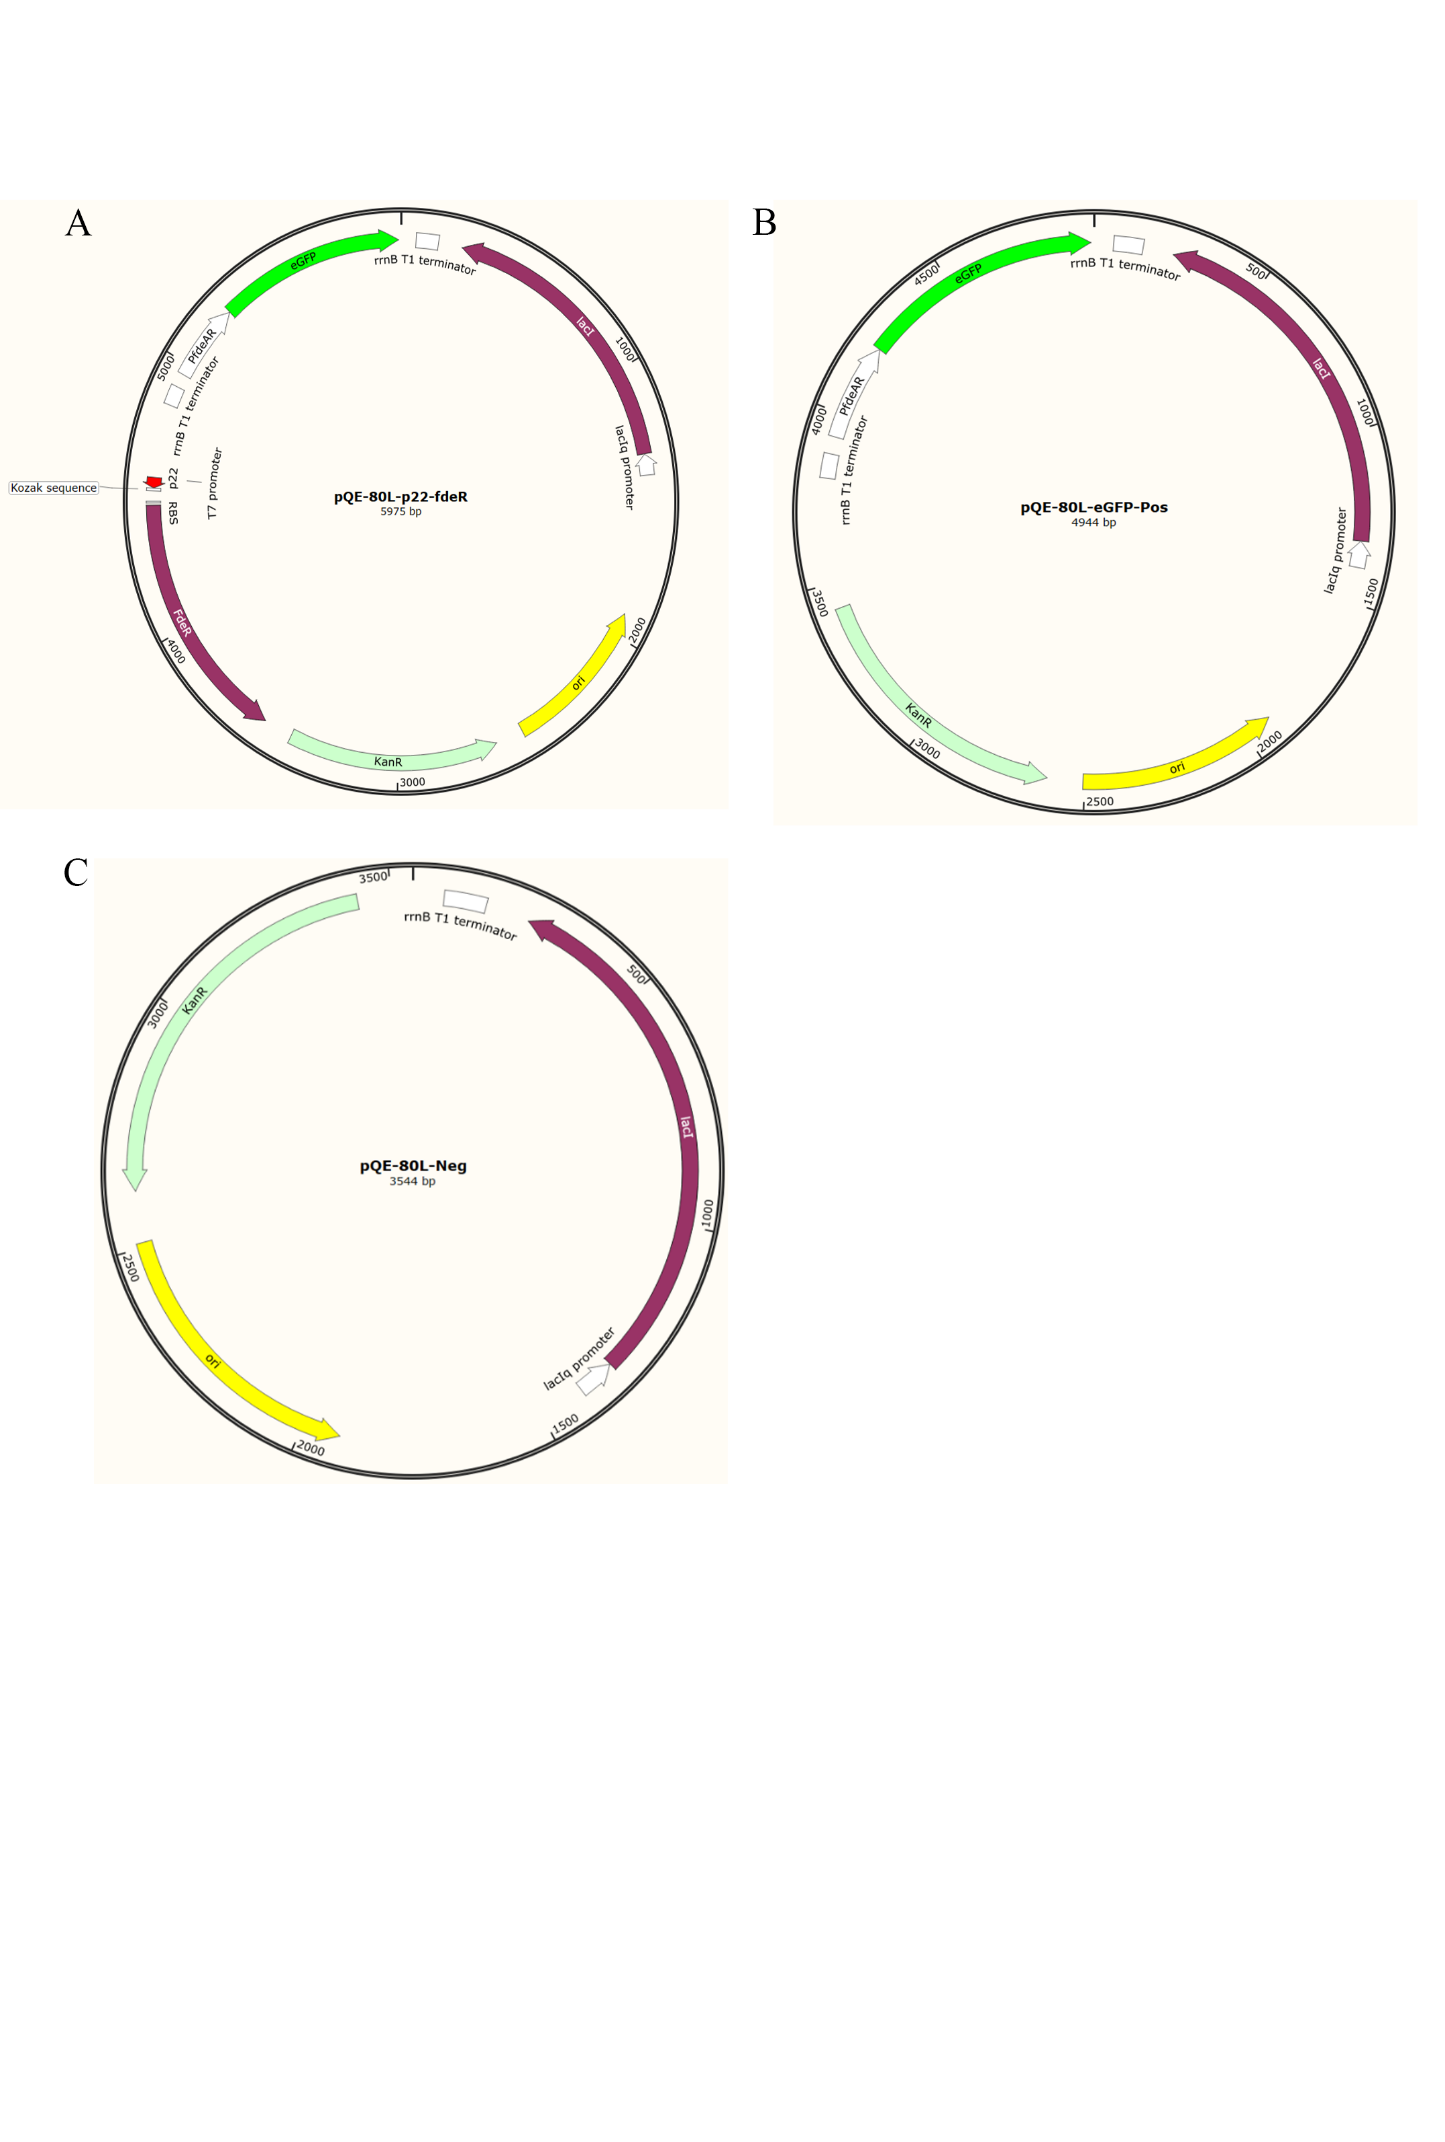
Figure S12. The map of plasmids used for directed evolution of allosteric transcription factors. (A) pQE-80L-p22-fdeR. This plasmid contains the fdeRbiosensor sequence. (B) pQE-80L-eGFP-Pos. The plasmid contains Spacer, PfdeAR and eGFP and is used as positive control in FACS. (C) pQE-80L-Neg. The plasmid without fdeR biosensor sequence is used as negative control in FACS.
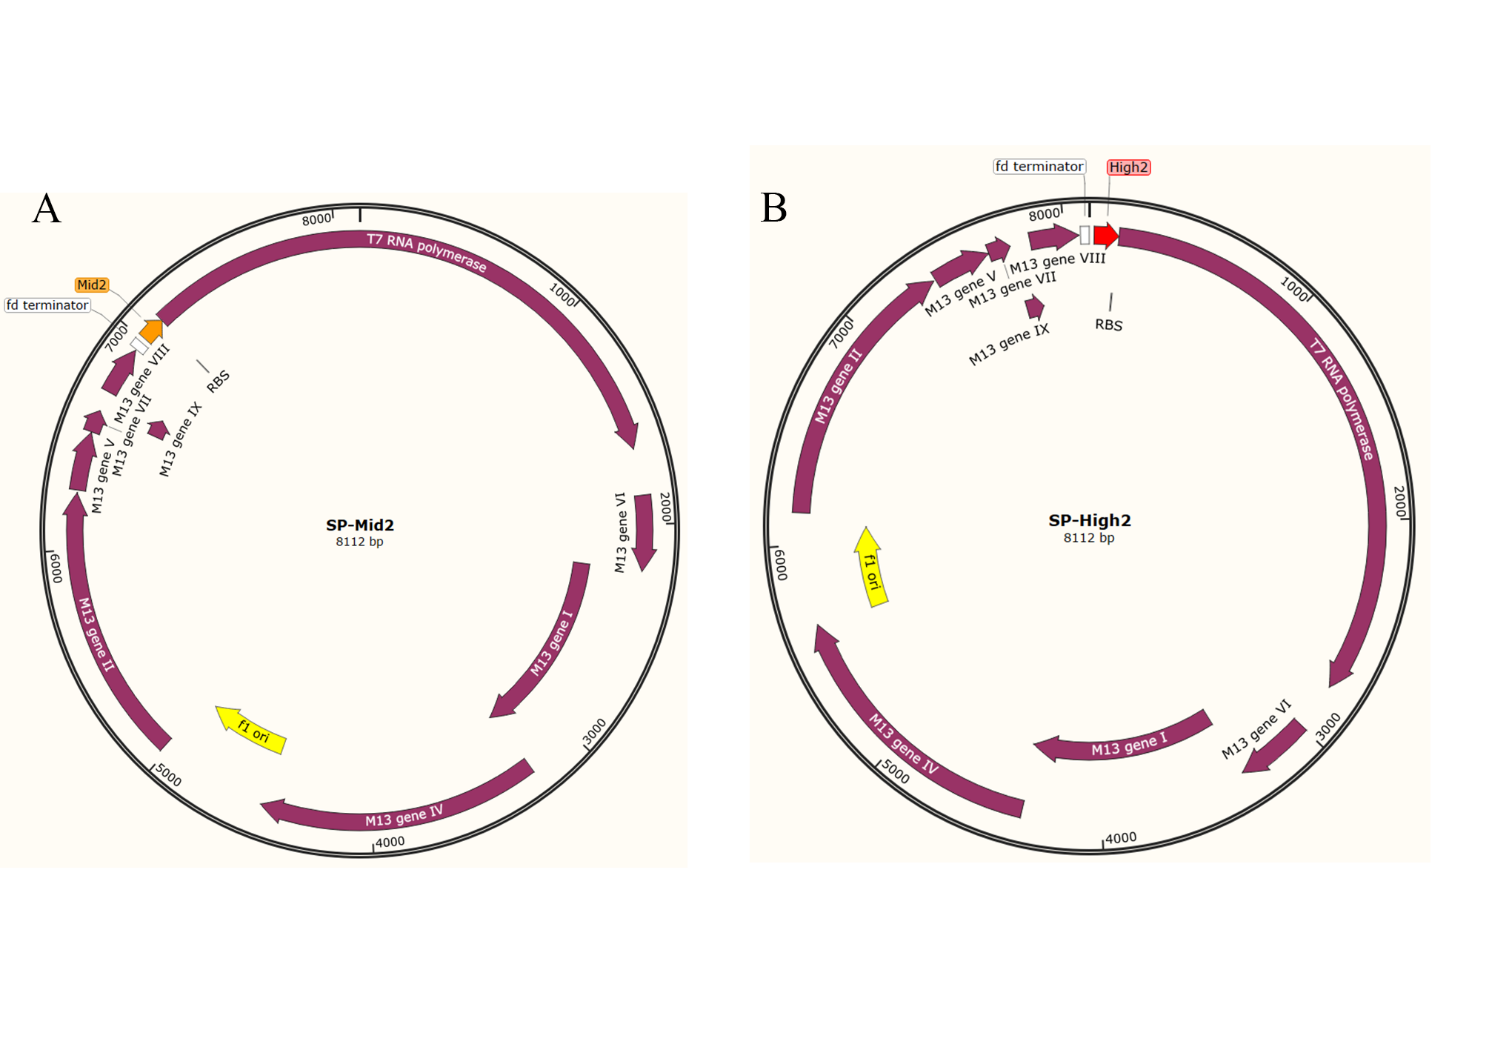
Figure S13. The Selection Phage plasmids map for PACE. (A) SP-Mid2. The SP plasmid is based on the M13 wild-type phage with the gIII removed, plus the riboswitch Mid2 to be mutated and T7 RNA polymerase. (B) SP-High2. The SP plasmid is based on the M13 wild-type phage with the gIII removed, plus the riboswitch Mid2 to be mutated and T7 RNA polymerase.
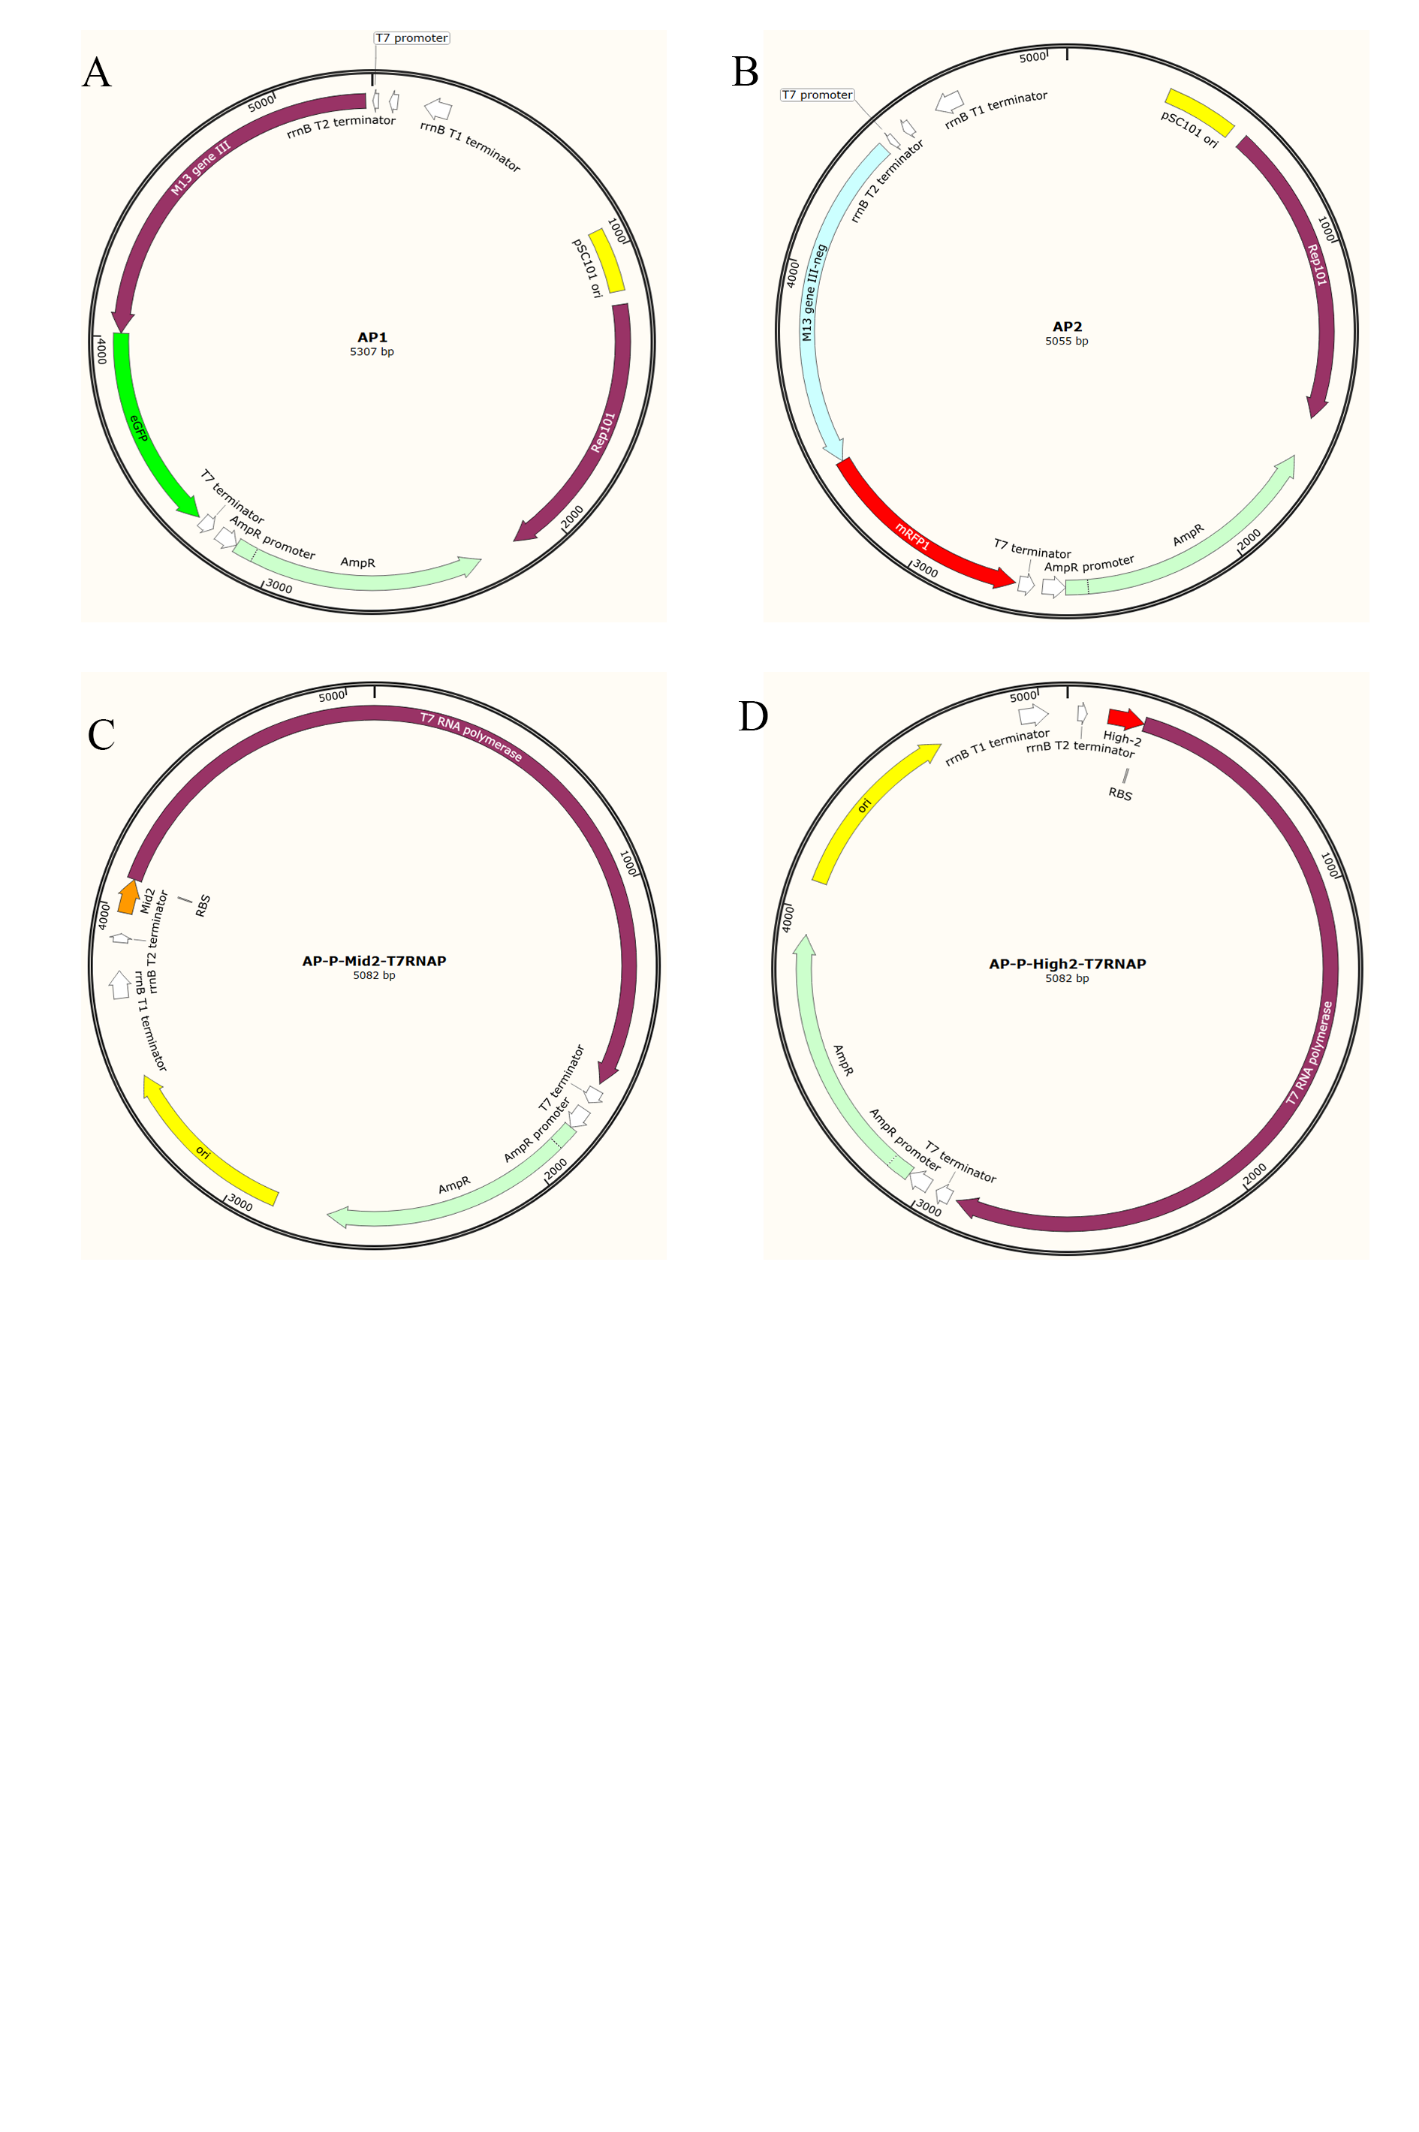
Figure S14. The Accessory Plasmids map for PACE. (A) Accessory Plasmid 1 (AP1). The plasmid containing M13 gⅢ and an eGFP downstream controlled by T7 promoter, is used in the positive selection in PACE. (B) Accesspry Plasmid 2 (AP2). The plasmid containing M13 gⅢ-neg and mRFP1 downstream controlled by T7 promoter, is used in the negative selection in PACE. (C) AP-P-Mid2-T7RNAP. The plasmid containing the riboswitch Mid2 and T7RNA polymerase sequence, is used in the Selection Phage (SP) assembly. (D) AP-P-Mid2-T7RNAP. The plasmid containing the riboswitch High2 and T7RNA polymerase sequence, is used in the Selection Phage (SP) assembly.
Table S1. Escherichia coli Strains which were used in this study.
| Names | Relevant characteristics | Source |
|---|---|---|
| E. coli DH5α | deoR endA1 gyrA96 hsdR17 (rk-mk+)recA1 relA1 supE44 thi-1 Δ(lacZYA-argF)U169 Φ80lacZ ΔM15F - λ - | Vazyme |
| E. coli BL21(DE3) | F-ompThsdS(rB-mB-) galdcm (DE3) | Vazyme |
| E. coli S2060 | F’ proA+B+ Δ(lacIZY) zzf::Tn10 lacIQ1 PN25-tetR luxCDE Ppsp(AR2) lacZ luxR Plux groESL / endA1 recA1 galE15 galK16 nupG rpsL ΔlacIZYA araD139 Δ(ara,leu)7697 mcrA Δ(mrr-hsdRMS-mcrBC) proBA::pir116 araE201 ΔrpoZ Δflu ΔcsgABCDEFG ΔpgaC λ– | addgene |
| E. coli S2208 | F’ proA+B+ Δ(lacIZY) zzf::Tn10 lacIQ1 PN25-tetR luxCDE Ppsp(AR2) lacZ luxR Plux groESL / endA1 recA1 galE15 galK16 nupG rpsL ΔlacIZYA araD139 Δ(ara,leu)7697 mcrA Δ(mrr-hsdRMS-mcrBC) proBA::pir116 araE201 ΔrpoZ Δflu ΔcsgABCDEFG ΔpgaC λ– | addgene |
Table S2. The plasmids which were used in this study.
| Names | Relevant characteristics | Purpose |
|---|---|---|
| pQE-80L | pBR322-KanR | Expression vector and negative control |
| pQE-80L-eGFP | pQE-80L-P22-T-PfdeAR-eGFP | Positive control |
| pQE-80L-fdeR | pBR322-p22-fdeR-T-PfdeAR-eGFP | Biosensor |
| pQE-80L-p22-fdeR-Mutpre-A | pBR322-p22-fdeR-Mutpre-L268W | Site-directed mutagenesis |
| pQE-80L-p22-fdeR-Mutpre-B | pBR322-p22-fdeR-Mutpre-H170W | Site-directed mutagenesis |
| pQE-80L-p22-fdeR-Mutpre-C | pBR322-p22-fdeR-Mutpre-H170Y | Site-directed mutagenesis |
| pQE-80L-p22-fdeR-Mutpre-D | pBR322-p22-fdeR-Mutpre-H170W+L268W | Site-directed mutagenesis |
| pQE-80L-p22-fdeR-Mutpre-E | pBR322-p22-fdeR-Mutpre-H170Y+L268W | Site-directed mutagenesis |
| AP1 | pSC101Cm-T7-gⅢ-eGFP | Positive selection |
| AP2-neg | pSC101Cm-T7-gⅢ-neg-RFP | Negative selection |
| DP6 | A plasmid expresses mutagenic genes | Expression of mutagenic genes |
| pBT137-C | M13 carrier section with replica origin | Construction of selection phage |
| pBT137-D | M13 carrier fraction containing gⅢ | Construction of selection phage |
| AP-P-Mid2-T7RNAP | Contains Narigenin riboswitch Mid2 and T7RNAP | Construction of selection phage |
| AP-P-High2-T7RNAP | Contains Narigenin riboswitch High2 and T7RNAP | Construction of selection phage |
| pJC175e | Provides low copy of gⅢ | Transform into S2060 competent cell to obtain S2208 |
Table. S3 The primers which were used in this study.
| No. | Name | Sequence (5’ -> 3’) | Function |
|---|---|---|---|
| 1 | H170Y-1-F | 5'-gcagacGTAccgttcgcggaagacctct-3' | Site-directed mutagenesis |
| 2 | SITE-1-R | 5'-cgcatatggtgcactctcagtaca-3' | Site-directed mutagenesis |
| 3 | H170Y-2-R | 5'-gaacggTACgtctgcgtggtctggcgc-3' | Site-directed mutagenesis |
| 4 | SITE-2-F | 5'-tgtactgagagtgcaccatatgcg-3' | Site-directed mutagenesis |
| 5 | L268W-1-F | 5'-ctcgccCCAcgacagcggactctccttgatc-3' | Site-directed mutagenesis |
| 6 | SITE-1-R | 5'-cgcatatggtgcactctcagtaca-3' | Site-directed mutagenesis |
| 7 | L268W-2-R | 5'-ctgtcgTGGggcgagatgcggcagatgat-3' | Site-directed mutagenesis |
| 8 | SITE-2-F | 5'-tgtactgagagtgcaccatatgcg-3' | Site-directed mutagenesis |
| 9 | H170W-1-F | 5'-gcagacCCAccgttcgcggaagacctct-3' | Site-directed mutagenesis |
| 10 | SITE-1-R | 5'-cgcatatggtgcactctcagtaca-3' | Site-directed mutagenesis |
| 11 | H170W-2-R | 5'-gaacggTGGgtctgcgtggtctggcgc-3' | Site-directed mutagenesis |
| 12 | SITE-2-F | 5'-tgtactgagagtgcaccatatgcg-3' | Site-directed mutagenesis |
| 13 | AP2-neg- GⅢneg-F | 5'-TTAAGACTCCTTATTACGCAGTATGTT-3' | Construction of AP2-neg |
| 14 | AP2-neg- GⅢneg-R | 5'-GGTGGCTCTTCCCAAATGGCTCAAGTCG-3' | Construction of AP2-neg |
| 15 | RFP-F | 5'-TGCTAGAACTGGCATGATTAAGCACCGGTGGAGTGAC-3' | Construction of AP2-neg |
| 16 | RFP-R | 5'-GTAATAAGGAGTCTTAAATGGCGAGTAGCGAAGACGT-3' | Construction of AP2-neg |
| 17 | AP2-neg-vector-F | 5'-TTTGGGAAGAGCCACCACCGGAACCG-3' | Construction of AP2-neg |
| 18 | AP2-neg- vector-R | 5'-TCATGCCAGTTCTAGCATAACCCC-3' | Construction of AP2-neg |
| 19 | AP2-pos-vector-F | 5'-CTCACCATTTAAGACTCCTTATTACGCAGTATGTTAG-3' | Construction of AP2-pos |
| 20 | AP2-pos-vector-R | 5'-ACAAGTAATCATGCCAGTTCTAGCATAACC-3' | Construction of AP2-pos |
| 21 | AP2-pos-eGFP-F | 5'-AGTCTTAAATGGTGAGCAAGGGCGAGGAG-3' | Construction of AP2-pos |
| 22 | AP2-pos-eGFP-R | 5'-TGGCATGATTACTTGTACAGCTCGTCCATGCC-3' | Construction of AP2-pos |
| 23 | pQE-pathway-vector-F | 5'-TAAGGCAGTTATTGGTGCCCTTA-3' | Construction of pQE-pathway |
| 24 | pQE-pathway-vector-R | 5'-TTCTCGAGGTGAAGACGAAAGG-3' | Construction of pQE-pathway |
| 25 | pQE-pathway-fragment-F | 5'-TCTTCACCTCGAGAATCAGCAGATGCCTGGCAGC-3' | Construction of pQE-pathway |
| 26 | pQE-pathway-fragment-R | 5'-CCAATAACTGCCTTAAAAAAATTACTTGTACAGCTCGTCCATGC-3' | Construction of pQE-pathway |
| 27 | pQE-SplitC-RBS-F | 5'-ACTAGACTACACTAAAAAGAGGACTATTCATCCGCTGCATGGCCCC-3' | Substitution of RBS of eGFP |
| 28 | pQE-SplitC-RBS-R | 5'-CGCATATGGTGCACTCTCAGTACAATCTG-3' | Substitution of RBS of eGFP |
| 29 | pQE-SplitD-RBS-F | 5'-TGTACTGAGAGTGCACCATATGCG-3' | Substitution of RBS of eGFP |
| 30 | pQE-SplitD-RBS-R | 5'-TCTTTTTAGTGTAGTCTAGTAATCCCGTTGATATTGATCAAATGGATTGTTTTG-3' | Substitution of RBS of eGFP |
| 31 | Mid2-random-F | 5'-CGATGCTGCTTATCGAAGTCTGA-3' | Nested PCR to obtain the fragment of Mid2 |
| 32 | Mid2-random-R | 5'-TGCAGAACGCGCCTGTTTATC-3' | Nested PCR to obtain the fragment of Mid2 |
| 33 | High2-random-F | 5'-AGGCGCGTTCTGCATTAGC-3' | Nested PCR to obtain the fragment of High2 |
| 34 | High-random-R | 5'-GCTGTAACAAGTTGTCTCAGGTGTTC-3' | Nested PCR to obtain the fragment of High2 |
| 35 | overlap-Mid2&High2-F | 5'-TACTACATAAATCAAACAGGGACGACGATGACACGAGA-3' | Overlap PCR to obtain Mid2-T7RNAP and High2-T7RNAP |
| 36 | overlap-Mid2-R | 5'-GTTAATCGTGTTCATAGATGCTCCTTCACTCGCATT-3' | Overlap PCR to obtain Mid2-T7RNAP and High2-T7RNAP |
| 37 | overlap-High2-R | 5'-GTTAATCGTGTTCATAGATGCTCCTTATTCCCCCC-3' | Overlap PCR to obtain Mid2-T7RNAP and High2-T7RNAP |
| 38 | overlap-T7RNAP-F | 5'-AGGAGCATCTATGAACACGATTAACATCGCTAAGA-3' | Overlap PCR to obtain Mid2-T7RNAP and High2-T7RNAP |
| 39 | overlap-T7RNAP-R | 5'-GGCATGAGCTCTTCAGCCTTACGCGAACGCGAAGTCC-3' | Overlap PCR to obtain Mid2-T7RNAP and High2-T7RNAP |
| 40 | overlap-AP-P-V-F | 5'-GTTCGCGTAAGGCTGAAGAGCTCATGCCAG-3' | Construction of the plasmid of AP-P-Mid2-T7RNAP and AP-P-High2-T7RNAP |
| 41 | overlap-AP-P-V-R | 5'-GTCGTCCCTGTTTGATTTATGTAGTAGACTAGAAGAGC-3' | Construction of the plasmid of AP-P-Mid2-T7RNAP and AP-P-High2-T7RNAP |
| 42 | ep-fdeR-F | 5'-ACCTCGAGAACGATGCTGCTTATCGAAGTCTGA-3' | Error-prone PCR to obtain fdeR |
| 43 | ep-fdeR-R | 5'-CTCGAATTCGGAGGAAACAAAG-3' | Error-prone PCR to obtain fdeR |
| 44 | ep-vec-F | 5'-TGTTTCCTCCGAATTCGAGGT-3' | Error-prone PCR to obtain pQE-80L used for vector |
| 45 | ep-vec-R | 5'-CATCGTTCTCGAGGTTCGTGATACGCCTATTTTTATAGGTTA-3' | Error-prone PCR to obtain pQE-80L used for vector |
Table S4. Hill parameters, operational ranges and noise parameter values of the constructed and characterised biosensors.
M: the maximum normalised fluorescent signal, a:the basal normalised fluorescent signal, n: Hill coefficient (cooperativity), KM:Hill constant (half-maximal Naringenin concentration) and k:proportional maximum response parameter. NA: Not applicable.
| Plasmid abbrev. | a (a.u.) | n | Km (mg/L) | k (a.u.) | Detection range (mM) | Noise |
|---|---|---|---|---|---|---|
| WT(NG) | 177909.6±964134.6 | 4.24±2.83 | 0.1±0.0 | 825±151 | 0.030-0.300 | 34.10% |
| WT(LG) | NA | NA | NA | NA | NA | 16.30% |
| 49-11(NG) | 4595.7±392763.3 | 0.21±1.59 | 1417031.5±1426850000 | 103320±18779200 | 0.000-0.061 | 23.30% |
| 49-11(LG) | 294088±170384.2 | 1.04±0.34 | 0.3±0.1 | 12423±2750 | 0.100-0.800 | 28.10% |
| 49-18(NG) | -1.1±456564.4 | 1.07±7.34 | 0±0.2 | 5376±1514 | 0.000-0.057 | 15.20% |
| 49-18(LG) | 72361.8±331886.8 | 1.99±0.45 | 0.2±0.0 | 11635±1045 | 0.050-0.600 | 52.00% |
| 49-36(NG) | 2429.9±115739.4 | 0.19±0.92 | 3407163.3±2177050000 | 97914±10160300 | 0.000-0.040 | 14.70% |
| 49-36(LG) | 29607.8±493213.6 | 0.9±0.45 | 0.9±1.5 | 24539±20141 | 0.000-1.000 | 64.00% |
| 49-39(NG) | 10784.9±664018.3 | 1.24±1.55 | 0.1±0 | 4846±1307 | 0.000-0.400 | 18.20% |
| 49-39(LG) | 2444392±782420 | 0.4±0.49 | 579206.3±476701000 | 2790738±888273000 | 0.000-1.000 | 20.80% |
| 49-49(NG) | 1599.8±199867.9 | 0.15±1.58 | 2663307.6±2608130000 | 53038±5764672 | 0.000-0.025 | 15.20% |
| 49-49(LG) | 215015.5±315889.9 | 0.61±0.54 | 95704.9±218666000 | 10349200±14388500000 | 0.000-1.000 | 44.90% |
| 49-66(NG) | NA | NA | NA | NA | NA | 7.60% |
| 49-66(LG) | 653795.8±190387.239 | 0.7±0.4 | 0.7±1.5 | 8344±6522 | 0.000-1.000 | 22.10% |
| 49-70(NG) | 1.5±720004.9 | 7.09±167.05 | 0.1±0.4 | 4161±765 | 0.057-0.1300 | 15.80% |
| 49-70(LG) | 2417977.2±1416681.1 | 0.34±0.68 | 308760.8±187508000 | 521719±102500000 | 0.000-1.000 | 20.60% |
| 49-92(NG) | NA | NA | NA | NA | NA | 21.00% |
| 49-92(LG) | 310381.4±257069.3 | 1.34±0.44 | 0.2±0 | 10165±1421 | 0.020-0.400 | 26.40% |
Table S5. Supplementary sequence.
The optimal PCR system ion environmental conditions were obtained by adjusting the amount of StarMut Enhancer. 0μL,2μL,4μL,6μL,8μL and 10μL before the sequence represented the amount of StarMut Enhancer added to the 20 μL PCR system respectively. When 4 μL of StarMut Enhancer was added, the results of fragment sequencing reflected the higher mutation rate and more evenly distributed of mutation sites. As a consequence this system was applied to our formal error-prone PCR.
0μL:
TCAGCAGATGCCTGGCAGCGCCGCATCCATCTCCTGCGCACTCTCCAGAAACACCCGACGCAGCCACTGGATGCCAGGATCATTGCTGC
GGTAGCGATGCCACTGCATCATCTGCCGCATCTCGCCCAGCGACAGCGGACTCTCCTTGATCACCACCGGCCATTGCGGAGCCAGCAGC
TGCGCCAGCCGGGCATGCACCGTGGCGATGCGGTCCGTCCCCTGTACCAGCGCCAGCGCAGAAGCGAAGCTGAAGCTGGTCACTTCCAC
CCGGCGCGCAAAGCCCAGCTTCCTGGCCATCCACGCCTCCACCGACGACGCATTGGCCCCAGGCGGCACCATCACCACATGGCCTGAGG
CCATGTAGCGTTCCAGCGTCAGCTCGCCTTGCGCCAGCGCACTGTCGCGCCAGACCACGCAGACATGCCGTTCGCGGAAGACCTCTTCGG
CAGGATGATCGGGCGTGCAGAATTCCTGCGGCAAGACCAGCAGGTCCACCTCGGCCCGATCCAGCGAGCGGGTCGGGTCTTGCACCTGC
GGCATCAGGGCAAAGCGGATGTGCTTGCCCTCGGCGTGCGCGCGCGCCAGCACCCGGGGGATGAGGACGGAGAGCGTAAAGTCCGAAA
CCGAGATGCGAAACTCGCGCGTGGACTCGGCCGGCACGAAGGCCGGCAGCGCCGCGATGGAGCCATCGATACGCCGCAGCACATCATG
CACCGCATCCTTGAGCACCTCGGCGCGCGGCGTGGGCTCCATGCGCCGGCCCACCTGGATCAGCAATTCATCATCGAAATACTCGCGCAG
CCGCGCCAGGGCATTGCTCATGGCCGACTGGGTCAGATGGATCTTTTCGGGGGGGCGGCTGATGCTCATCTCCGTGAGCAGTGCATCCAG
GGCGACCAGAAGATTGAGGTCGAGCTTGTTGAAACGCAT
2μL:
TCAGCAGATGCCTGGCAGCGCCGCATCCATTTCCTGCGCACTCTCCAGAAACACCCGACGCAGCCACTGGATGCCAGGATCATTGCTGCGG
TAGCGATGCCACTGCATCATCTGCCGCATCTCGCCCAGCGACAGCGGACTCTCCTTGATCACCACCGGCCATTGCGGAGCCAGCAGCTGCG
CCAGCCGGGCATGCACCGTGGCGATGCGGTCCGTCCCCTGTACCAGCGCCAGCGCAGAAGCGAAGCTGAAGCTGGTCACTTCCACCCGGC
GCGCAAAGCCCAGCTTCCTGGCCATCCACGCCTCCACCGACGACGCATTGGCCCCAGGCGGCACCATCACCACATGGCCTGAGGCCATGTA
GCGTTCCAGCGTCAGCTCGCCTTGCGCCAGCGCACTGTCGCGCCAGACCACGCAGACATGCCGTTCGCGGAAGACCTCTTCGGCAGGATGA
TCGGGCGTGCAGAATTCCTGCGGCAAGACCAGCAGGTCCACCTCGGCCCGATCCAGCGAGCGGGTCGGGTCTTGCACCTGCGGCATCAGGG
CAAAGCGGATGTGCTTGCCCTCGGCGTGCGCGCGCGCCAGCACCCGGGGGATGAGGACGGAGAGCGTAAAGTCCGAAACCGAGATGCGAA
ACTCGCGCGTGGACTCGGCCGGCACGAAGGCCGGCAGCGCCGCGATGGAGCCATCGATACGCCGCAGCACATCATGCACCGCATCCTTGAG
CACCTCGGCGCGCGGCGTGGGCTCCATGCGCCGGCCCACCTGGATCAGCAATTCATCATCGAAATACTCGCGCAGCCGCGCCAGGGCATTGC
TCATGGCCGACTGGCTTCAGATGGAATCTTTTCGGGCGGGCGCGGCTGATGCTCATCTCCGTGAGCAGTGCATCCAGGGCGACCAAAAAATT
GAGGTCGAGCTTGTTGAAACGCAT
4μL:
TCAGCAGATCCCTGGCAGCGCCGCATCCATCTCCTGCGCACTCTCCAGAAACACCCGACGCAGCCACTGGATGCCAGGATCATTGCTGCGGT
AGCGATGCCACTGCATCATTCTGCCGCATCTCGCCCAGCGACAGCCGACTCTCCTTGATCACCACCGGCCCATTGCGGAGCCAGCAGCTGCGCCA
GCCGGGCAAGCACCGTGGCGATGCGGTCCGTCCCCCTGTACCAGCGCCAGCGCAGAAGCGAAGCTGAAGCTGGTCACTTCCACCCCGCGCGCAA
AGCCCAGCTTCCTGGCCATCCACGGCCTCCACCGACGACGCATTGGCCCCAGGCGGCACCATCACCACATGGCCTGAGGCCATGTAGCGTTCCAG
CGTCAGCTCGCCTTGCGCCAGCGCACTGTCGCGCCAGACCACGCAGACATGCCGTTCGCGGAAGACCTCTTCGGCAGGATGATCGGGCGTGCAGA
ATTCCTGCGGCAAGACCAGCAGGTCCACCTCGGCCCGATCCAGCGAGCGGGTCGGGTCTTGCACCTGCGGCATCAGGGCAAAGCGGATGTGCTTG
CCCTCGGCGTGCGCGCGCGCCAGCACCCGGGGGATGAGGACGGAGAGCGTAAAGTCCGAAACCGAGATGCGAAACTCGCGCGTGGACTCGGCCG
GCACGAAGGCCGGCAGCGCCGCGATGGAGCCATCGATACGCCGCAGCACATCATGCACCGCATCCTTGAGCACCTCGGCGCGCGGCGTGGGCTCC
ATGCGCCGGCCCACCTGGATCAGCAATTCATCATCGAAATACTCGCGCAGCCGCGCCAGGGCATTGCTCATGGCCGACTGGCTCAGATGGATCTTT
TCGGCGGCGCGGCTGATGCTCATCTCCGTGAGCAGTGCATCCAGGGCGACCAAAAGATTGAGGTCGAGCTTGTTGAAACGCAT
6μL:
TCAGCAGATGCCTGGCAGCGCCGCATCCATTTCCTGGGCATTCTCCAGAAACACCCGACGCAGCCACTGGATGCCAGGATCATTGCTGCGGTA
GCGATGCCACTGCATCATCTGCCGCATCTCGCCCAGCGACAGCGGACTCTCCTTGATCACCACCGGCCATTGCGGAGCCAGCAGCTGCGCCAGCCG
GGCATGCACCGTGGCGATGCGGTCCGTCCCCTGTACCAGCGCCAGCGCAGAAGCGAAGCTGAAGCTGGTCACTTCCACCCGGCGCGCAAAGCCCA
GCTTCCTGGCCATCCACGCCTCCACCGACGACGCATTGGCCCCAGGCGGCACCATCACCACATGGCCTGAGGCCATGTAGCGTTCCAGCGTCAGCTC
GCCTTGCGCCAGCGCACTGTCGCGCCAGACCACGCAGACATGCCGTTCGCGGAAGACCTCTTCGGCAGGATGATCGGGCGTGCAGAATTCCTGCGG
CAAGACCAGCAGGTCCACCTCGGCCCGATCCAGCGAGCGGGTCGGGTCTTGCACCTGCGGCATCAGGGCAAAGCGGATGTGCTTGCCCTCGGCGTG
CGCGCGCGCCAGCACCCGGGGGATGAGGACGGAGAGCGTAAAGTCCGAAACCGAGATGCGAAACTCGCGCGTGGACTCGGCCGGCACGAAGGCCG
GCAGCGCCGCGATGGAGCCATCGATACGCCGCAGCACATCATGCACCGCATCCTTGAGCACCTCGGCGCGCGGCGTGGGCTCCATGCGCCGGCCCA
CCTGGATCAGCAATTCATCATCGAAATACTCGCGCAGCCGCGCCAGGGCATTGCTCATGGCCGACTGGCTCAGATGGATCTTTTCGGCGGCGCGGCT
GATGCTCATCTCCGTGAGCAGTGCATCCAGGGCGACCAGAAGATTGAGGTCGATCGAGCTTGTTGAAACGCAT
8μL:
TCAGCAGATGCCTGGCAGCGCCGCATCCATCTCCTGCGCACTCTCCAGAAACACCCGACGCAGCCACTGGATGCCAGGATCATTGCTGCGGTAG
CGATGCCACTGCATCATCTGCCGCATCTCGCCCAGCGACAGCGGACTCTCCTTGATCACCACCGGCCATTGCGGAGCCAGCAGCTGCGCCAGCCGGG
CATGCACCGTGGCGATGCGGTCCGTCCCCTGTACCAGCGCCAGCGCAGAAGCGAAGCTGAAGCTGGTCACTTCCACCCGGCGCGCAAAGCCCAGCTT
CCTGGCCATCCACGCCTCCACCGACGACGCATTGGCCCCAGGCGGCACCATCACCACATGGCCTGAGGCCATGTAGCGTTCCAGCGTCAGCTCGCCT
TGCGCCAGCGCACTGTCGCGCCAGACCACGCAGACATGCCGTTCGCGGAAGACCTCTTCGGCAGGATGATCGGGCGTGCAGAATTCCTGCGGCAAGA
CCAGCAGGTCCACCTCGGCCCGATCCAGCGAGCGGGTCGGGTCTTGCACCTGCGGCATCAGGGCAAAGCGGATGTGCTTGCCCTCGGCGTGCGCGCG
CGCCAGCACCCGGGGGATGAGGACGGAGAGCGTAAAGTCCGAAACCGAGATGCGAAACTCGCGCGTGGACTCGGCCGGCACGAAGGCCGGCAGCGC
CGCGATGGAGCCATCGATACGCCGCAGCACATCATGCACCGCATCCTTGAGCACCTCGGCGCGCGGCGTGGGCTCCATGCGCCGGCCCACCTGGATCA
GCAATTCATCATCGAAATACTCGCGCAGCCGCGCCAGGGCATTGCTCATGGCCGACTGGCTCAGATGGATCTTTTCGGCGGCGCGGCTGATGCTCATC
TCCGTGAGCAGTGCATCCAGGGCGACCAGAAGATTGAGGTCGAGCTTGTTGAAACGCAT
10μL:
TCAGCAGATGCCTGGCAGCGCCGCATCCATCTCCTGCGCACTCTCCAGAAACACCCGACGCAGCCACTGGATGCCAGGATCATTGCTGCGGTAG
CGATGCCACTGCATCATCTGCCGCATCTCGCCCAGCGACAGCGGACTCTCCTTGATCACCACCGGCCATTGCGGAGCCAGCAGCTGCGCCAGCC
GGGCATGCACCGTGGCGATGCGGTCCGTCCCCTGTACCAGCGCCAGCGCAGAAGCGAAGCTGAAGCTGGTCACTTCCACCCGGCGCGCAAAGCC
CAGCTTCCTGGCCATCCACGCCTCCACCGACGACGCATTGGCCCCAGGCGGCACCATCACCACATGGCCTGAGGCCATGTAGCGTTCCAGCGTC
AGCTCGCCTTGCGCCAGCGCACTGTCGCGCCAGACCACGCAGACATGCCGTTCGCGGAAGACCTCTTCGGCAGGATGATCGGGCGTGCAGAATT
CCTGCGGCAAGACCAGCAGGTCCACCTCGGCCCGATCCAGCGAGCGGGTCGGGTCTTGCACCTGCGGCATCAGGGCAAAGCGGATGTGCTTGCC
CTCGGCGTGCGCGCGCGCCAGCACCCGGGGGATGAGGACGGAGAGCGTAAAGTCCGAAACCGAGATGCGAAACTCGCGCGTGGACTCGGCCGGC
ACGAAGGCCGGCAGCGCCGCGATGGAGCCATCGATACGCCGCAGCACATCATGCACCGCATCCTTGAGCACCTCGGCGCGCGGCGTGGGCTCCA
TGCGCCGGCCCACCTGGATCAGCAATTCATCATCGAAATACTCGCGCAGCCGCGCCAGGGCATTGCTCATGGCCGACTGGCTCAGATGGATCTT
TTCGGCGGCGCGGCTGATGCTCATCTCCGTGAGCAGTGCATCCAGGGCGACCAAAAGATTGAGGTCGAGCTTGTTGAAACGCAT
Table S6. DNA sequence of liquiritigenin biosensor
Annotated nucleotide sequence of the complete pQE-80L-fdeR plasmid constructed in this study. FdeR is highlighted in purple, the RBS in orange, the Kozak sequence in cornflower blue, the P22 core promoter in red, the rrnB T1 terminator in grey, PfdeAR in yellow, eGFP in green.
Tcagcagatgcctggcagcgccgcatccatctcctgcgcactctccagaaacacccgacgcagccactggatgccaggatcattgctgcggtagcgatgccact
gcatcatctgccgcatctcgcccagcgacagcggactctccttgatcaccaccggccattgcggagccagcagctgcgccagCcgggcatgcaccgtggcgat
gcggtccgtcccctgtaccagcgccagcgcagaagcgaagctgaagctggtcacttccacccggcgcgcaaagcccagcttcctggccatccacgcctccacc
gacgacgcattggccccaggcggcaccatcaccacatggcctgaggccatgtagcgttccaGcgtcagctcgccttgcgccagcgcactgtcgcgccagacc
acgcagacatgccgttcgcggaagacctcttcggcaggatgatcgggcgtgcagaattcctgcggcaagaccagcaggtccacctcggcccgatccagcgag
cgggtcgggtcttgcacctgcggcatcagggcaaagcggatgTgcttgccctcggcgtgcgcgcgcgccagcacccgggggatgaggacggagagcgta
aagtccgaaaccgagatgcgaaactcgcgcgtggactcggccggcacgaaggccggcagcgccgcgatggagccatcgatacgccgcagcacatcatgcac
cgcatccttgagcacctcggcgcgcgGcgtgggctccatgcgccggcccacctggatcagcaattcatcatcgaaatactcgcgcagccgcgccagggcattgct
catggccgactggctcagatggatcttttcggcggcgcggctgatgctcatctccgtgagcagtgcatccagggcgaccagaagattgaggtcgagcttgttgaa
acgcatctttgtttcctccgaattcgaggtcgacggatcccaagcttcttctagagcggccgccatggATATGTACACATTATATCACATCTATTCCAAAAT
GTCAActgaaggcgctcctcatactggctgaatacatgacccgacacgttatcagaatttatcatgtcatgattgcttacaatactcacataattgtgaaaattgtag
aagccgcaacattcaattatcaatcaaaatcatgtccgcgccagtttcgttcctcgccgttgcactaatacagggtaattccctcaccacataaggaattaatgacgtca
ggtggcacttttccacagcactaatacagggtaattccctcaccacataaggacaggagagcgttcaccgacaaacaacagataaaacgaaaggcccagtcttt
cgactgagcctttcgttttatttgatgcctggcagttccccaatcagtcggaacggcaatgctagcccatggttaggcgctggtctccgttgttgtgcttgttcttgcc
gaccctcggatagacgacggatggggtggtcaatgtattgatgccgtccatatcatgaatcaaaacaatccatttgatcaatatcaagctcactcttaagcttcact
Tcatccgctgcatggccccaccagaaagggctggcgcggcaagccggcggcgcactcgcactggatgcgccgctgttgagcctggccatgacaacgcgccga
tagcggccacaccccgccaggcagggtaggagacaaggagacagacatggtgagcaagggcgaggagctgttcaccggggtggtgcccatcctggtcgag
ctggacggcgacgtaaacggccacaagttcagcgtgtccggcgagggcgagggcgatgccacctacggcaagctgaccctgaagttcatctgcaccaccggcaa
gctgcccgtgccctggcccaccctcgtgaccaccctgacctacggcgtgcagtgcttcagccgctaccccgaccacatgaagcagcacgacttcttcaagtccgcc
atgcccgaaggctacgtccaggagcgcaccatcttcttcaaggacgacggcaactacaagacccgcgccgaggtgaagttcgagggcgacaccctggtga
accgcatcgagctgaagggcatcgacttcaaggaggacggcaacatcctggggcacaagctggagtacaactacaacagccacaacgtctatatcatggccg
acaagcagaagaacggcatcaaggtgaacttcaagatccgccacaacatcgaggacggcagcgtgcagctcgccgaccactaccagcagaacacccccatcggcg
acggccccgtgctgctgcccgacaaccactacctgagcacccagtccgccctgagcaaagaccccaacgagaagcgcgatcacatggtcctgctggagttcgtgacc
gccgccgggatcactctcggcatggacgagctgtacaagtaa
Table S7. DNA sequences of riboswiches.
| Type of riboswitch | Sequence of riboswitches |
|---|---|
| Mid2 | gggacgacgatgacacgagatgccaaagggcagtactagcagttgtggtagagtcaccacaaccatatggcatacgccgatcacatgaccaaatgcgagtgaaggagcatct |
| High2 | gggacgacgatgacacgagatgccaaagggcagtactagcagttgtggtagagtcaccacaaccatatggcatacgccgatcacatgaccagggggggaataaggagcatct |