
Mutation libraries were established using two strategies: error-prone PCR (epPCR) and site-directed mutagenesis. Two rounds of epPCR targeting the fdeR gene with the StarMut Random Mutagenesis Kit, constructing a mutation library of 5.9×10⁶ mutants. Optimization of the PCR ion environment via gradient experiments resulted in a stable epPCR system with an appropriate mutation rate, ranging from 5 ~ 22 mutation bases per kilobase (kb) (Table S5).
Meanwhile, site-directed mutation was performed on the fdeR gene through seamless cloning, creating five combinations of mutation sites. Based on the known amino acid sequence of FdeR,1 the three-dimensional (3D) structure of FdeR was predicted using AlphaFold22 (Figure S3, S4A, and B). AutoDock 4.2.63 was employed to explore potential liquiritigenin binding sites on FdeR (Figure S4C, D, and E). Following energy minimization principle, the optimal docking result was selected from 50 docking results, demonstrating hydrogen bond interactions between FdeR's Arg220, Thr244, and Leu268 and liquiritigenin (Figure 1A and B). Besides, the docking analysis of FdeR and promoter indicated liquiritigenin is unlikely to cause steric hindrance with DNA (Figure S5). The binding energy of this conformation was within an reasonable range, justifying its selection for site-directed mutation. Subsequently, a full mutation scanning on amino acids within 3 Å of liquiritigenin identified mutations L268W, H170Y, and H170W (Table 1).4 Containing five mutation combinations: L268W, H170Y, H170W, L268W + H170Y and L268W + H170W, the site-directed mutation library was transformed into E. coli BL21 for subsequent fluorescence screening experiments.
Table 1. Main characteristics of FdeR single mutation prediction
| Index | Mutation | Mutation Energy (kcal/mol) | Effect |
|---|---|---|---|
| 1 | A:HIS170>TRP | -0.83 | STABILIZING |
| 2 | A:LEU268>TYR | -0.73 | STABILIZING |
| 3 | A:HIS170>TYR | -0.57 | STABILIZING |
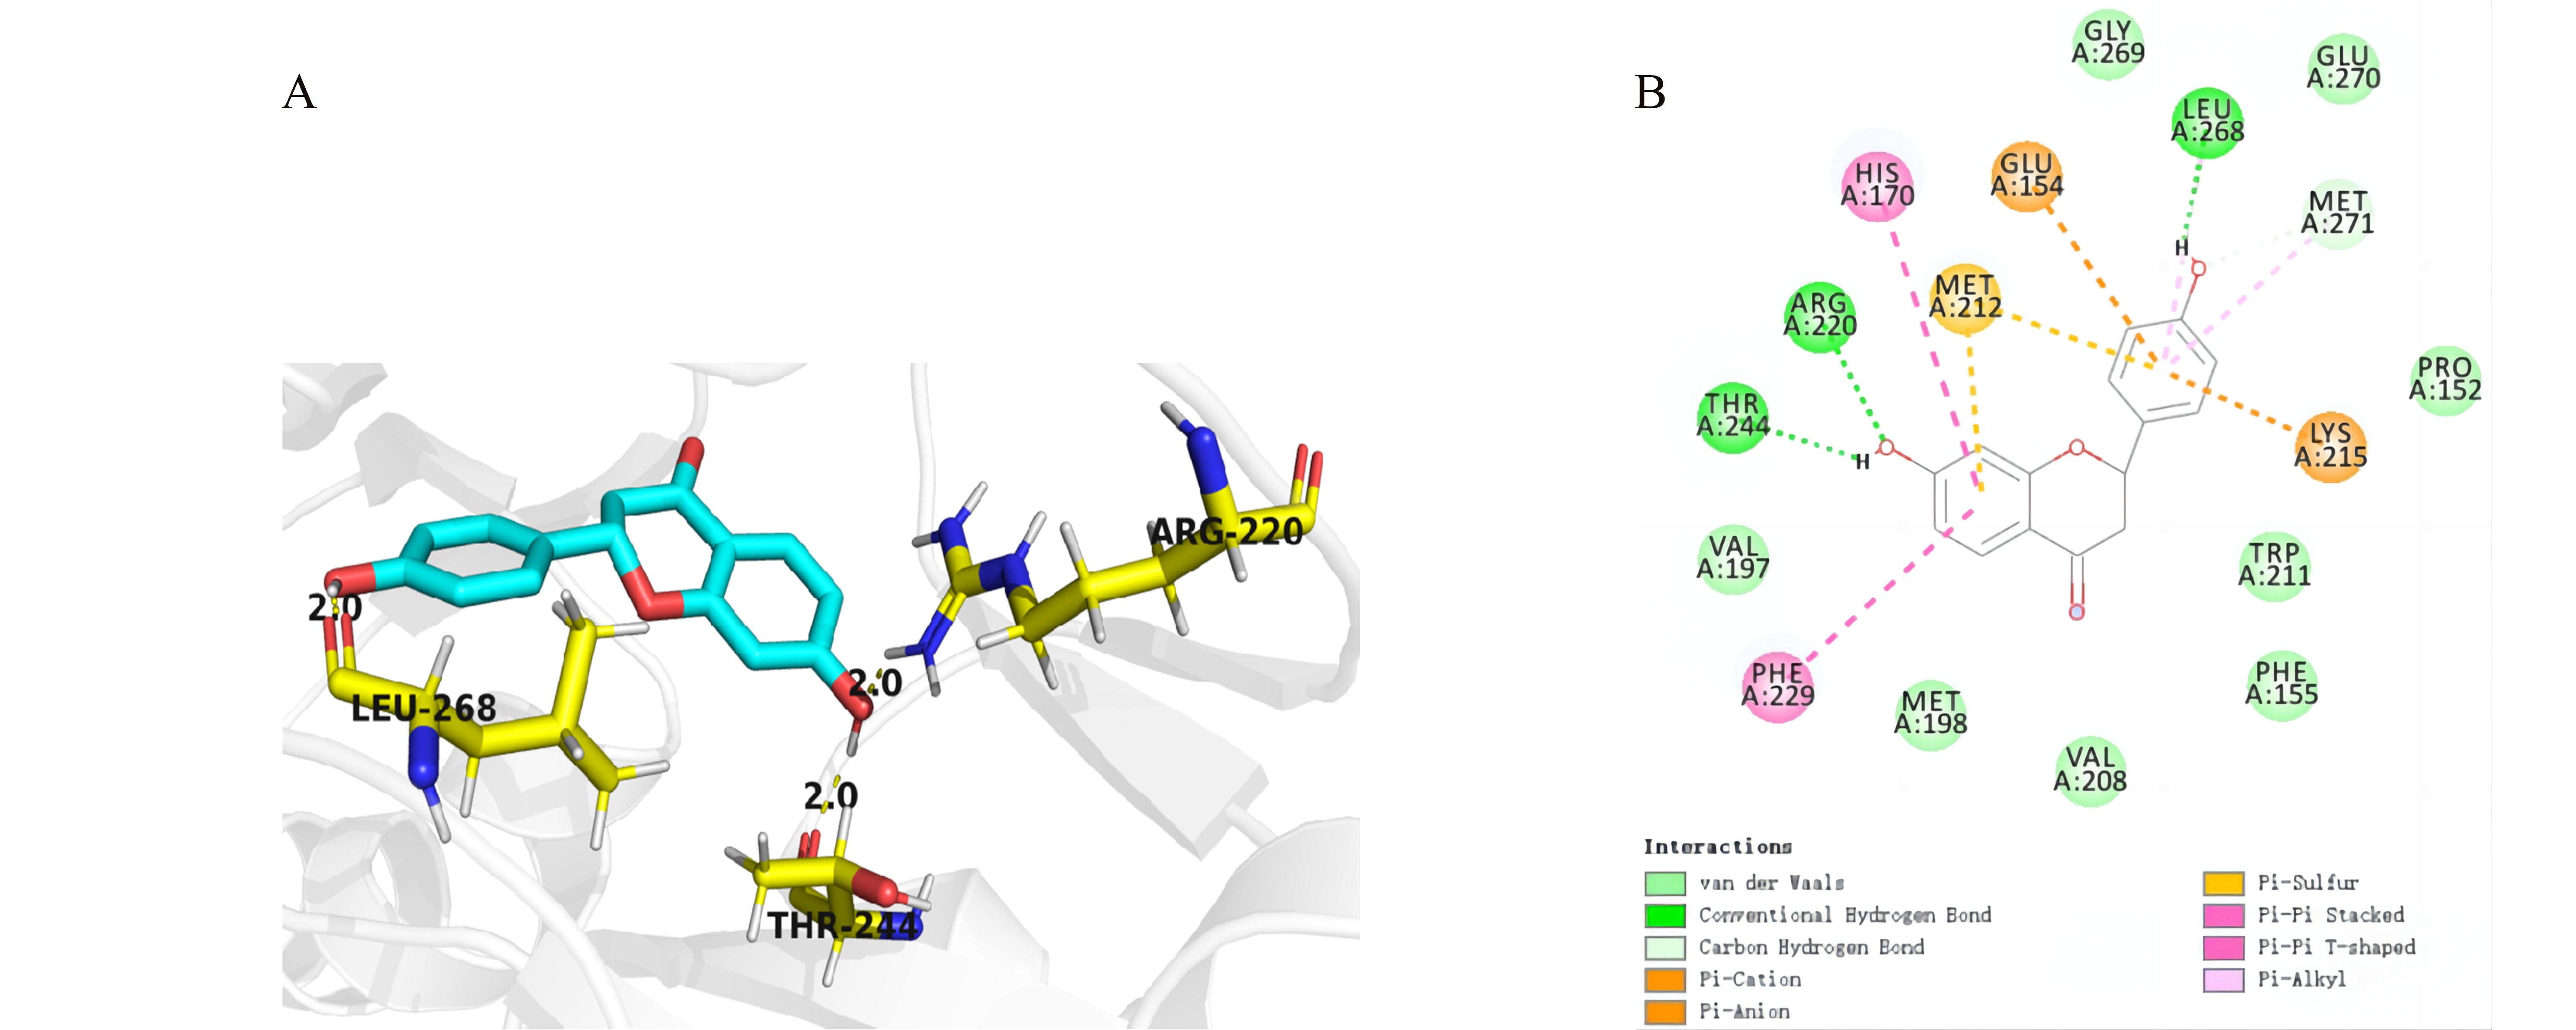
Figure 1. (A) Hydrogen Bond Contacts between FdeR and liquiritigenin. Amino acid residues on FdeR that form hydrogen bond contacts with liquiritigenin are labeled and represented using ball-and-stick models. Yellow dashed lines represent hydrogen bonds, and the numbers labeled above indicate the bond lengths. (B) Interactions between FdeR and liquiritigenin, including hydrogen bonds and various π bonds, as well as the bond lengths for each type of bond.
With a sorting rate of up to 70,000 events per second, FACS technology was applied to screening for mutants that specifically and efficiently identify liquiritigenin to while having no or only low responsiveness to naringenin (Figure 2 and Figure S6).
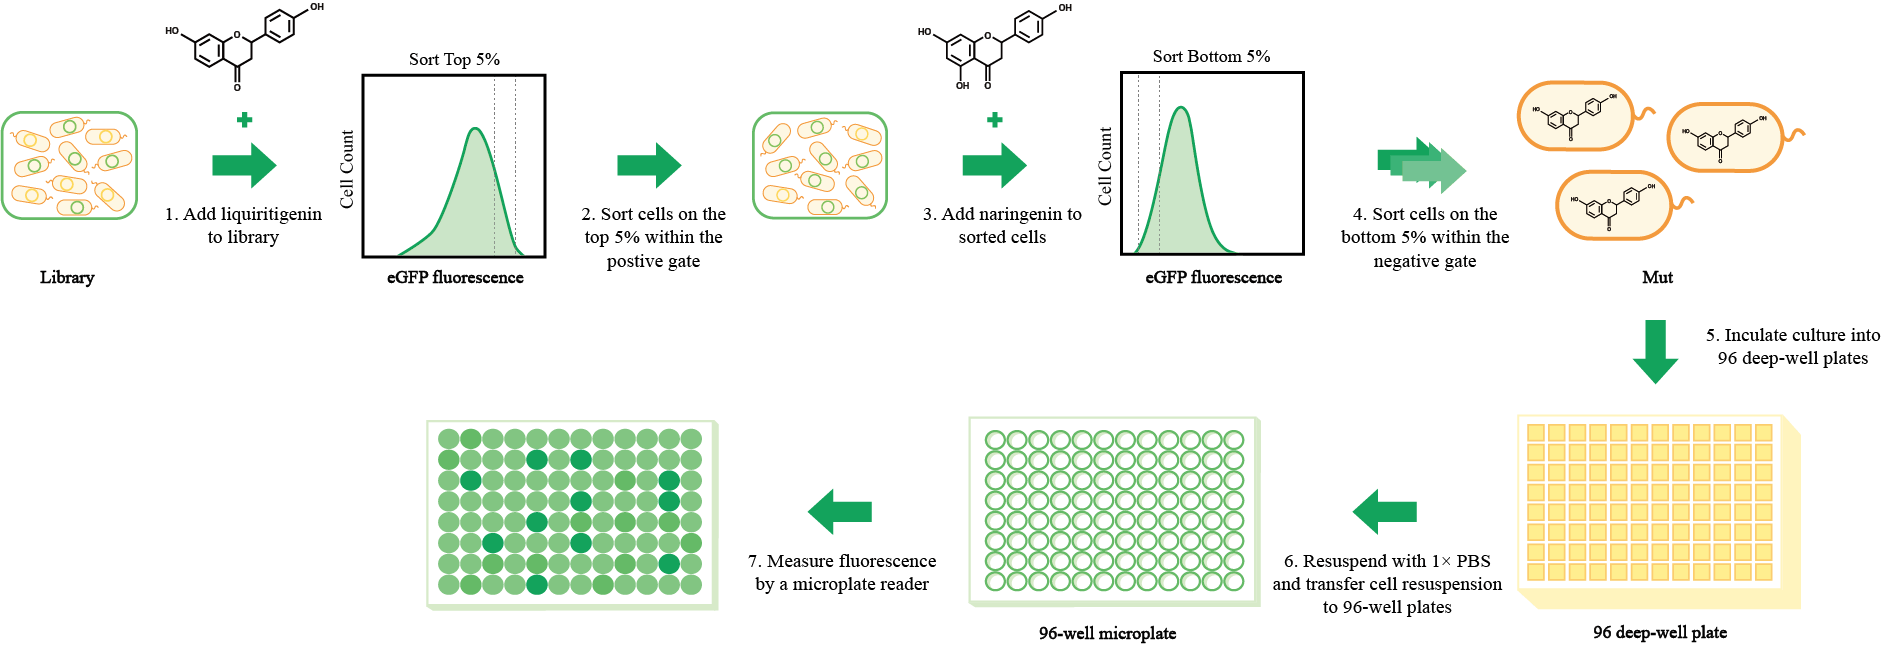
Figure 2. Flow chart of mutants screening. (1) Add liquiritigenin to library; (2) Sort cells on the top 5% within the positive gate; (3) Add naringenin to sorted cells; (4) Sort cells on the bottom 5% within negative gate; (5) Inculate culture into 96 deep-well plates; (6) Resuspend with 1× PBS and transfer cell resuspension to 96-well plates; (7) Measure fluorescence by a microplate reader.
In the first round of epPCR, six parallel epPCR systems were established for positive screening. Supplemented with 0.5 mM liquiritigenin and naringenin separately, positive selections and negative selections were performed on the library (Figure 3A and B). Subsequently, 320 individual clones were used for 96-well microplate screening.
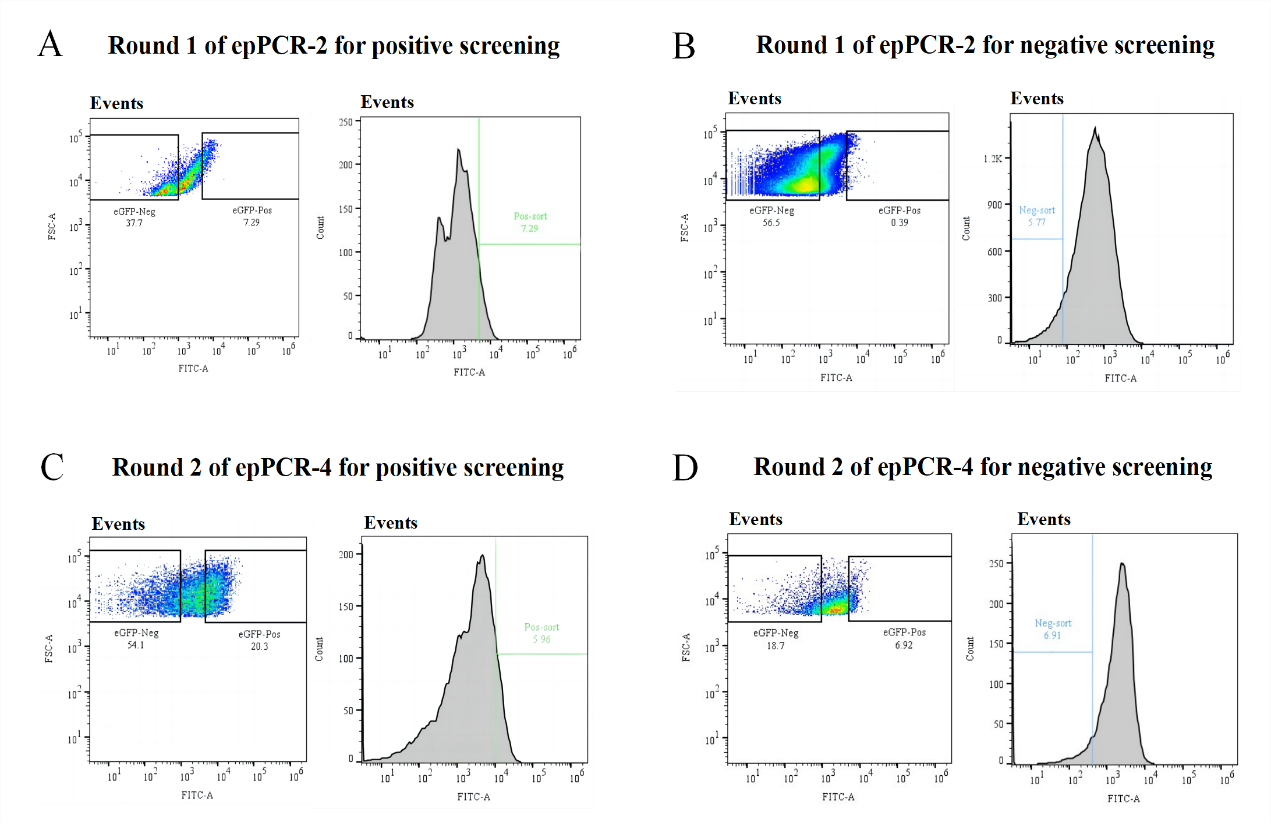
Figure 3. Flow cytometry analysis partly and FACS screening of the epPCR-2 and -4 library. Rounds of FACS screening were performed alternating positive sorting (library culture in the presence of 0.5 mM in the first round of epPCR or 0.35 mM in the second round of epPCR liquiritigenin and sorting of the events in the top of the histogram) and negative sorting (library culture in the presence of 0.5 mM in the first round of epPCR or 1.0 mM naringenin in the second round of epPCR and sorting of the events in the bottom of the fluorescence histogram). Round 1 of the epPCR library: (A) Positive screening was analyzed in a FCS-A vs. FITC-A scatter plot and the GFP Neg. (37.7%) and GFP Pos. (7.29%) gates were set. An Events vs. FITC-A histogram plot was created and the Pos. Sort gate was delimitated to sort the 7.29% most fluorescent events. (B) Negative screening was analyzed in a FCS-A vs. FITC-A scatter plot and the GFP Neg. (56.5%) and GFP Pos. (0.39%) gates were set. An Events vs. FITC-A histogram plot was created and the Pos. Sort gate was delimitated to sort the 5.77% least fluorescent events. Rouns 2 of the epPCR library: (C) Positive screening was analyzed in a FCS-A vs. FITC-A scatter plot and the GFP Neg. (54.1%) and GFP Pos. (20.3%) gates were set. An Events vs. FITC-A histogram plot was created and the Pos. Sort gate was delimitated to sort the 5.96% most fluorescent events. (D) Negative screening was analyzed in a FCS-A vs. FITC-A scatter plot and the GFP Neg. (18.7%) and GFP Pos. (6.92%) gates were set. An Events vs. FITC-A histogram plot was created and the Pos. Sort gate was delimitated to sort the 6.91% least fluorescent events.
This yielded a mutant library with a 2-10-fold increase in liquiritigenin response intensity compared to the wild type (Figure 4A). Among them, Mut_49 stood out, displaying a remarkable 10-fold increase in peak fluorescence compared to the wild type. To further enhance the sensitivity and specificity of this biosensor in responding to liquiritigenin, we subjected four variants, namely Mut_39, Mut_49, Mut_58, and Mut_81, with favorable fluorescence characteristics to the next round of epPCR (Figure 3C and D). Finally, Mut_49_70 with a fluorescence intensity nearly 100 times higher than the wild type was isolated (Figure 4B), indicating a significant enhancement in this biosensor in responding to liquiritigenin.
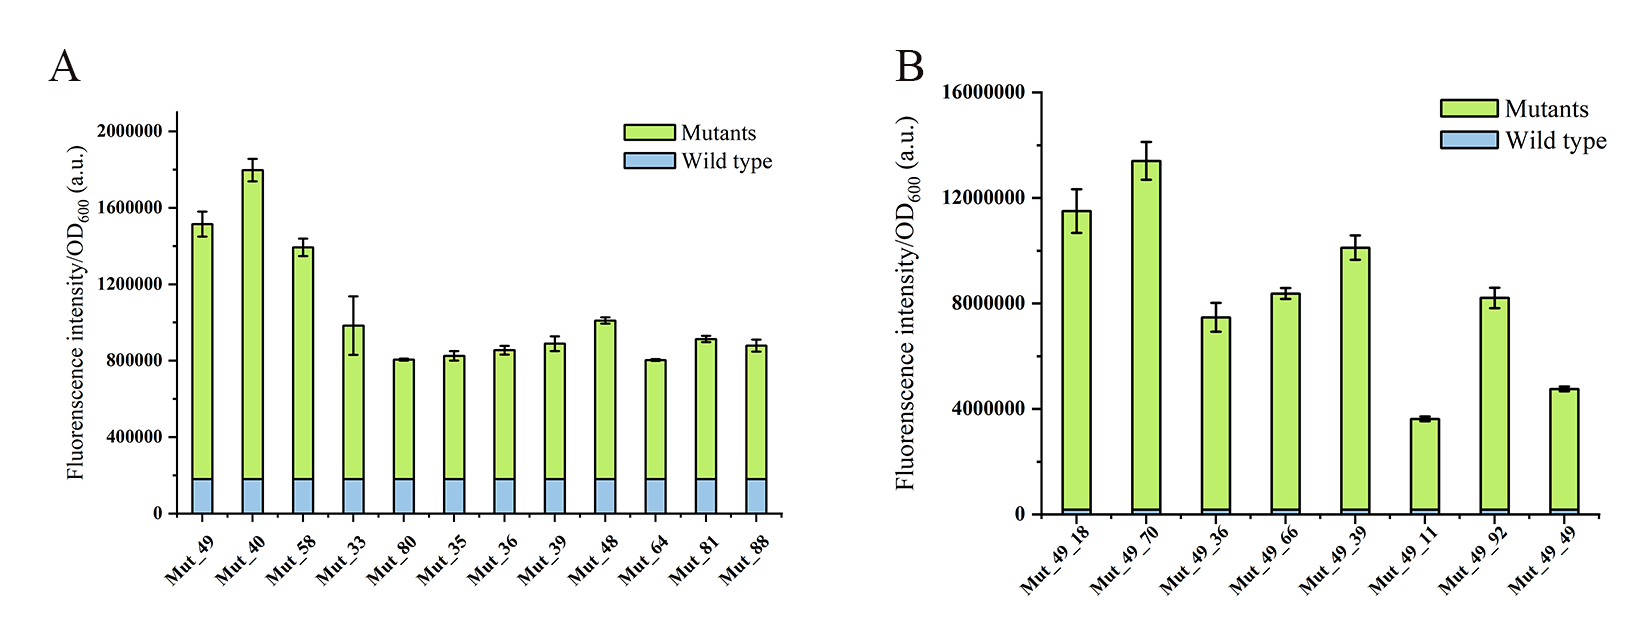
Figure 4. Comparison of the fluorescence intensities of mutants and the wild-type to liquiritigenin. (A) Mutants obtained from the first round epPCR. (B) Mutants obtained from the second round epPCR. Mutants and wild-type were induced with 1 mM liquiritigenin for 12 hours. The green bars represent the fluorescence intensities of different mutants, while the blue bars represent the fluorescence intensity of the wild-type.
In site-directed mutation experiments, we performed a 96-deep well microplate screening with 1.0 mM liquiritigenin or 1.0 mM naringenin. Regrettably, the mutants exhibit no significant increase in response intensity to liquiritigenin or naringenin compared to the wild-type FdeR (Figure 5). Consequently, a dose-response analysis for these mutants was not conducted, necessitating a reevaluation of our bioinformatics-based predictions.
R. Wassem et al.5 demonstrated that FdeR recognizes and binds to the PfdeA promoter, inhibiting RNA polymerase access. Upon binding flavonoids, like naringenin, FdeR undergoes conformational changes altering its DNA-binding site, enabling RNA polymerase binding and transcription initiation. Initial molecular docking focused on the individual FdeR monomer interaction with liquiritigenin, neglecting dynamic changes in FdeR binding to the PfdeA promoter and its oligomeric state in vivo. Future research will readdress this aspect through molecular docking to identify novel mutation sites.5
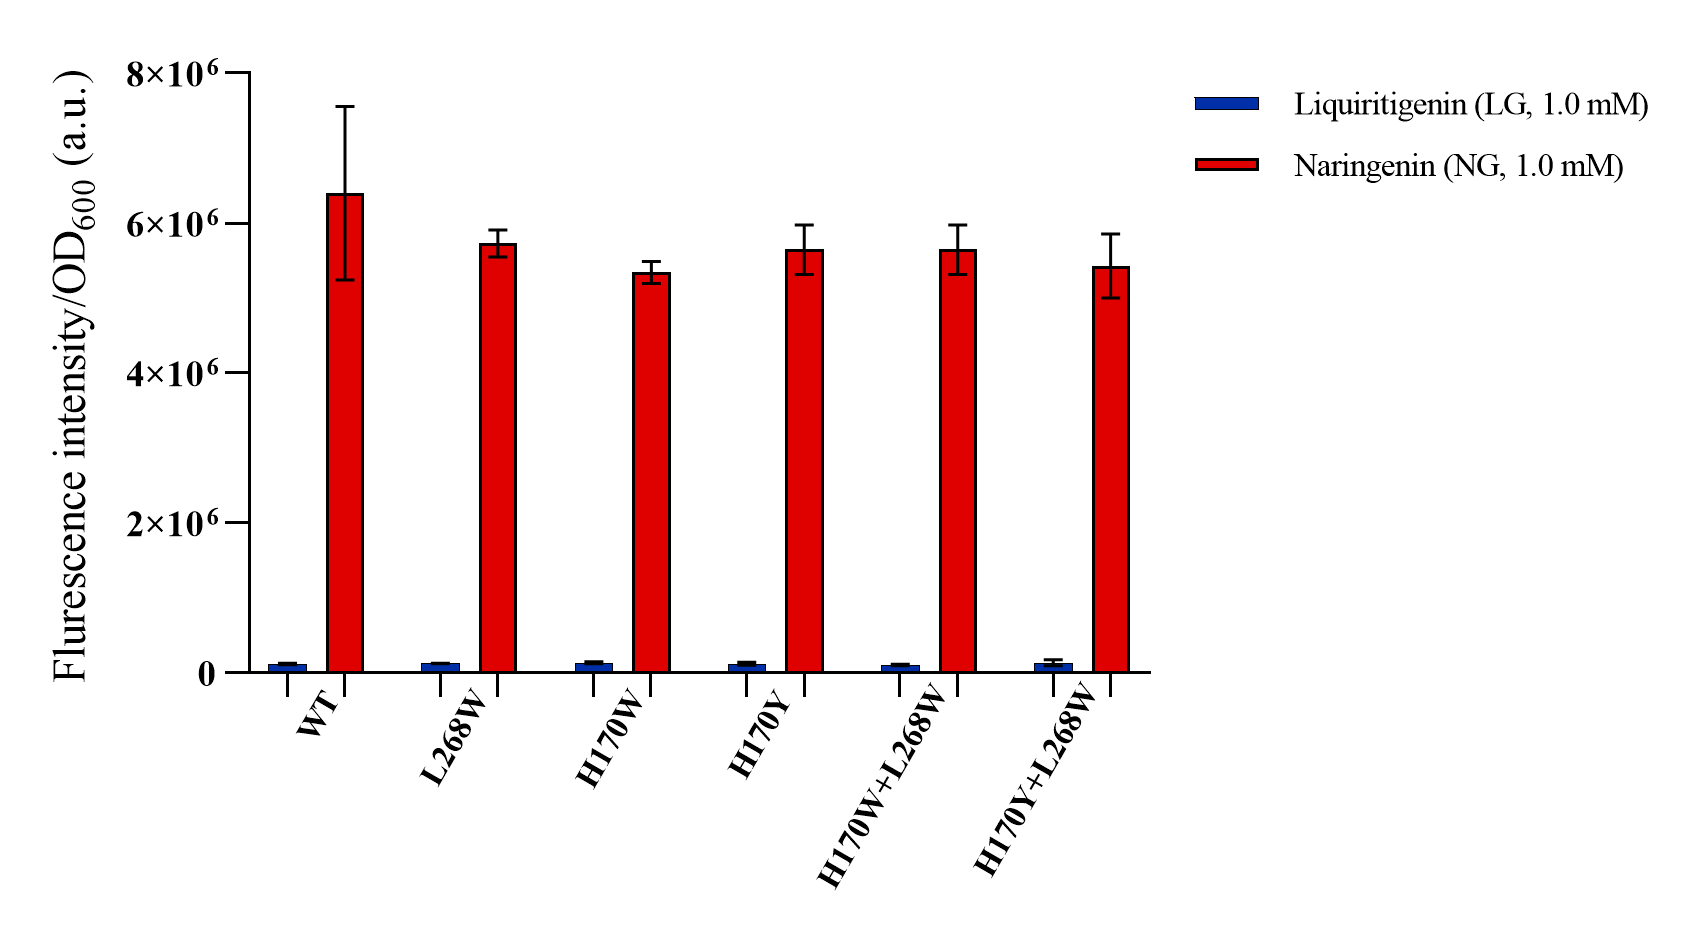
Figure 5. Dose responses to liquiritigenin and naringenin of different mutantgensis constructs. Wild-type (WT) and five combinations of mutantgensis L268W, H170Y, H170W, H170W + L268W, H170Y + L268W were cultivated for 12 h in the presence of increasing concentrations of liquiritigenin (blue) and naringenin (red) in 500 µM. Error bars are based on the standard deviation of a minimum of biological triplicate.
Based on the 96-well microplate fluorescence screening, eight mutants with high fluorescence intensity responses to liquiritigenin were selected for gradient experiments, varying liquiritigenin concentration and induction time, to characterize their performance as biosensor, including sensitivity, detection range, response time, and specificity, modeled using Hill functions to analyze dose impact.5 We defined operational range as the ligand concentration range and response intensity as fluorescence intensity divided by OD 600. We also introduced a Noise parameter to quantify average relative error in fluorescence response across concentrations, a vital aspect in biosensor development and application.
Compared to the initial state, all eight mutants showed substantial 10-100-fold enhancements in fluorescence response intensity (Figure 4B), exhibiting a positive correlation within the 0-1 mM liquiritigenin concentration range, with most reaching a plateau at 0.5 mM liquiritigenin (Figure 6, Table S4). Notably, Mut_49_70 and Mut_49_39 exhibited more higher fluorescence intensity and a broader detection range. Even at 1 mM liquiritigenin, their response curves continued to show an upward trend, while Noise parameters both remained around 20%. Next, the response time capabilities of the eight mutants were assessed (Figure 7). While the wild-type FdeR displayed an S-shaped time response curve, with fluorescence intensity increasing soomthly within 6 hours and peaking at 10 hours, Mut_49_70 exhibited a significantly longer response time. It showed rapid early-stage intensity rise within 2 hours, reaching its peak at approximately 12 hours, indicating Mut_49_70 can respond quickly to liquiritigenin in the environment.

Figure 6. The dose-response curves for liquiritigenin of the wild type and the mutants are as follows:The blue curve represents the dose-response curve for the wild type. Various green curves represent the dose-response curves for the 8 mutants.
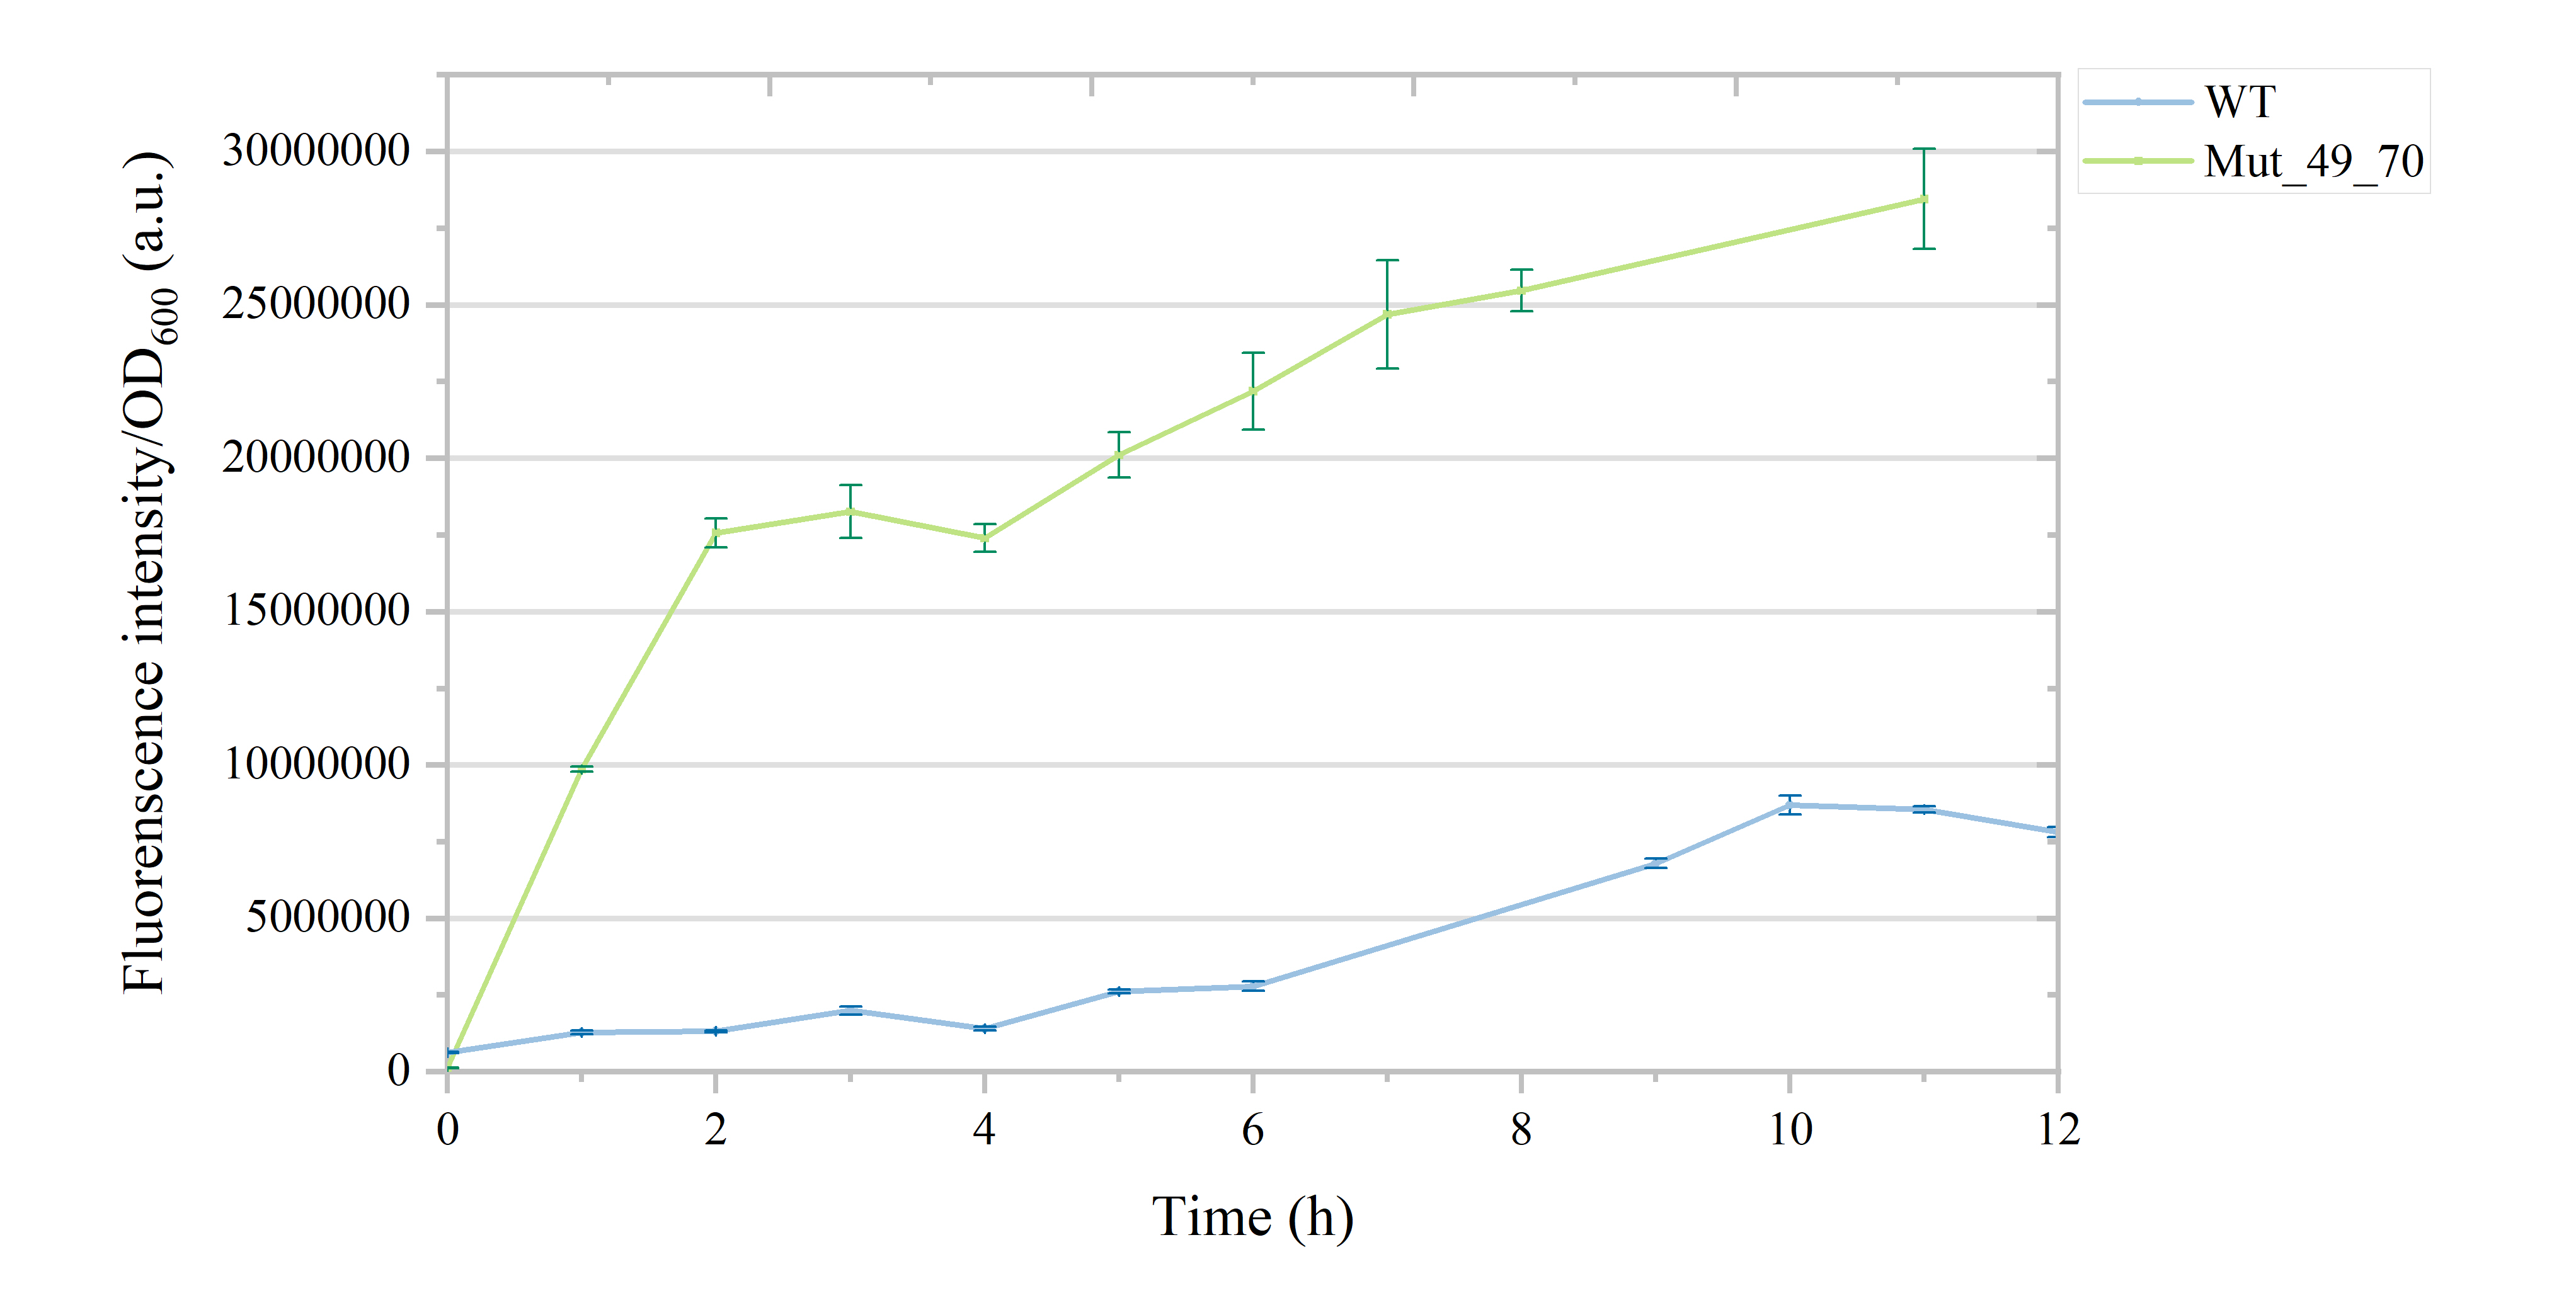
Figure 7. The response time curves for liquiritigenin of the wild type and Mut_49_70 are as follows:The blue curve represents the response time curve for the wild type. The green curve represents the response time curve for the mutant Mut_49_70.
To evaluate specificity, we conducted dose-response experiments for naringenin in the 8 mutants (Figure 8 and Figure S8). These mutants exhibited strong specificity, with most displaying over a 5-fold difference in response intensity to liquiritigenin compared to naringenin. Notably, Mut_49_70 showed the highest fluorescence intensity among the mutants, exceeding 1.7×10⁷ a.u.. However, its response intensity to naringenin also ranked the highest, reaching approximately 2.1×10⁶ a.u. (still lower than wild-type FdeR). And Mut_49_39 exhibited impressive fluorescence response intensity, reaching up to 1.2×10⁷ a.u., with significantly stronger specificity for liquiritigenin than Mut_49_70. Mut_49_39 displayed a broader dynamic range, maintaining an upward trend in fluorescence intensity even at a 1.0 mM liquiritigenin concentration, which is often considered as an ideal characteristic for a biosensor.
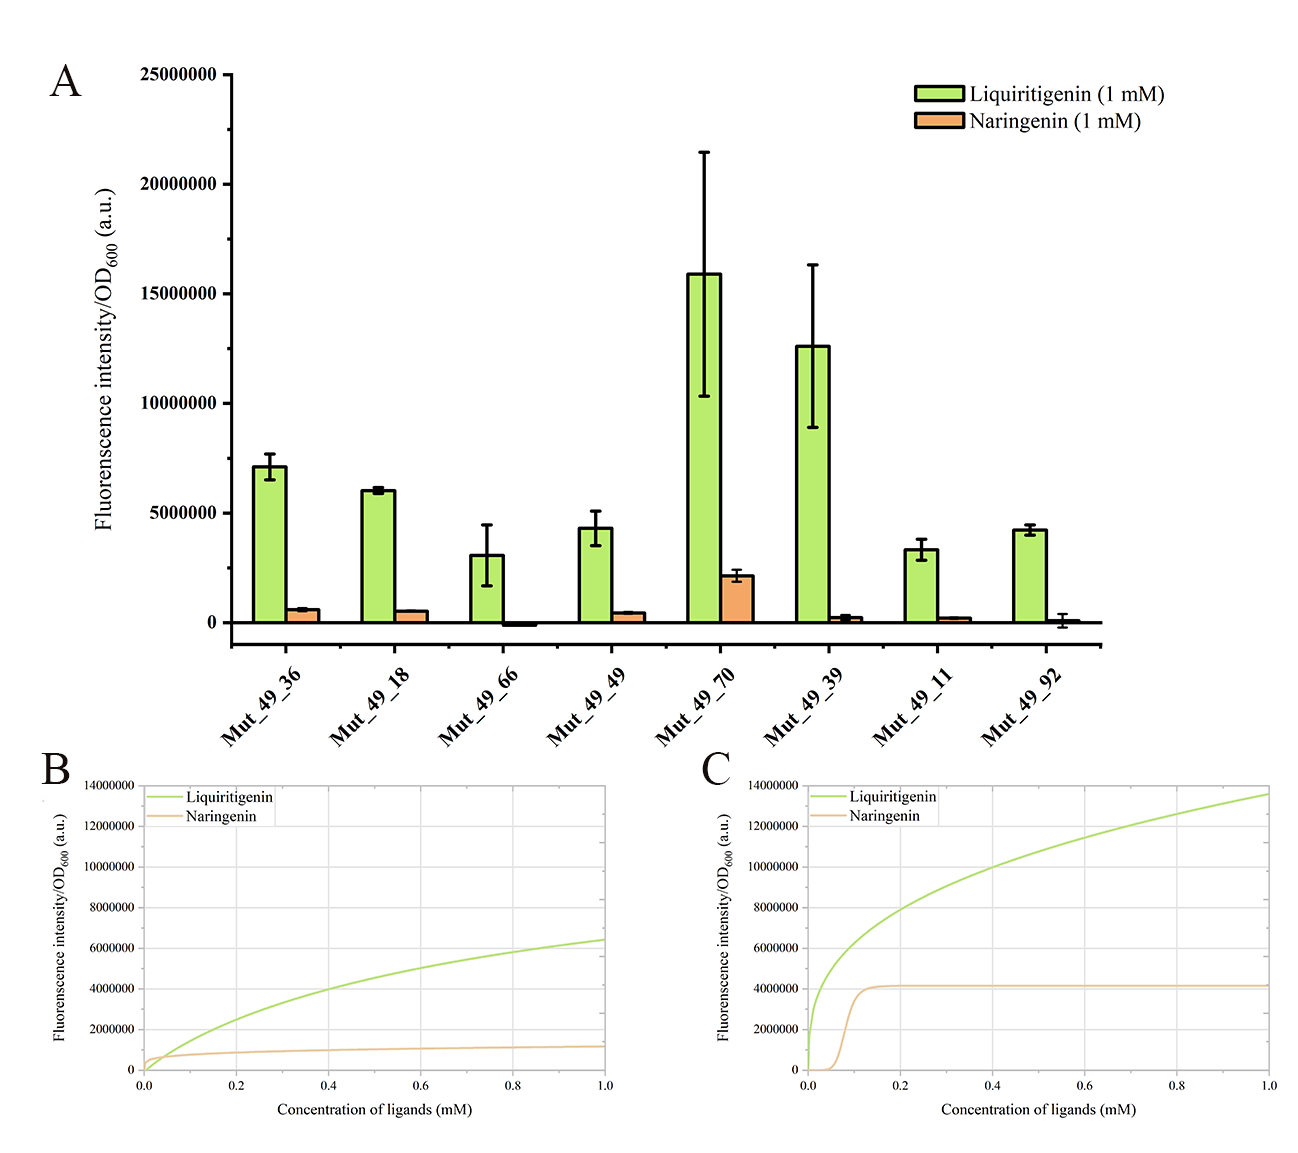
Figure 8. Fluorescence intensities of different mutants to liquiritigenin and naringenin.(A) Fluorescence intensities of 8 mutants at 1 mM liquiritigenin and naringenin, where green bars represent the liquiritigenin, and orange bars represent the naringenin. (B) The dose-response curves for the Mut_49_39 mutant to liquiritigenin and naringenin. (C) The dose-response curves of the Mut_49_70 mutant to liquiritigenin and naringenin. The green curve represents liquiritigenin, and the orange curve represents naringenin in the dose-response curves for both ligands.
Additionally, We identified mutations, including D71E, S140P, M191T, and S297C, enriched in most mutants. Remarkably, elongation mutations were observed in Mut_33, Mut_48, Mut_49, and Mut_64, enhancing their responsiveness and specificity to liquiritigenin (Figure 9A and 4). Compared to Mut_49, F106L and V134L mutations enriched in Mut_49_75, Mut_49_77, Mut_49_78, Mut_49_18, and Mut_49_36, while E163V and I308S mutations were enriched in Mut_49_40 and Mut_49_41 (Figure 9B). And Mut_49_39 and Mut_49_70 showed no additional mutations, but an mutation (G to A) was detected between the promoter and RBS, potentially influencing biosensor performance at the transcriptional or translational level, resulting in both mutants constructing the best-performing biosensors. These sequencing results serve as the foundation for subsequent molecular dynamics simulations.
In summary, among the 8 mutants studied, Mut_49_39 and Mut_49_70 demonstrated a broader response range (exceeding 1 mM), faster response kinetics (within 2 hours), and a relatively normal Noiseparameter (about 20%). Consequently, Mut_49_39 and Mut_49_70 hold substantial potential for constructing highly efficient and specific liquiritigenin biosensors.
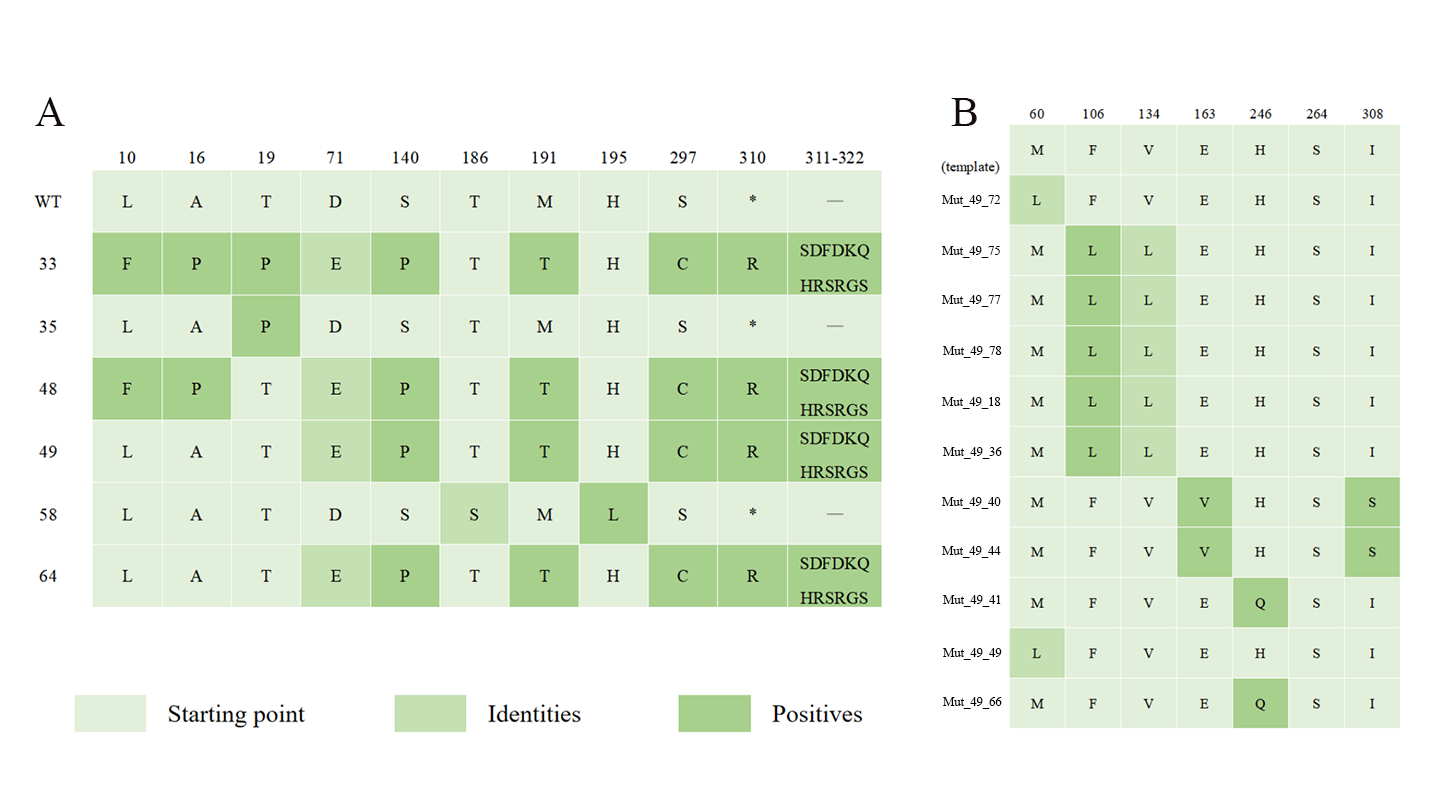
Figure 9. The amino acid mutation heatmap of the mutants.(A) After the first round of error-prone PCR, six mutants were identified. Among them, four mutants exhibited enrichment in mutations at S140P, M191T, and S297C, and leading to extended mutations spanning twelve amino acids. (B) The mutants obtained after the second round of error-prone PCR, using Mut_49 as a template, were sequenced and analyzed.
After predicting the three-dimensional structure of Mut_49, this mutant was docked with liquiritigenin, analying changes in intermolecular forces and binding pocket hydrophobicity(Figure 10). The results indicated that Mut_49 revealed higher hydrophobicity in the binding region compared to the wild-type, suggesting enhanced affinity and specificity for liquiritigenin. Unfortunately, upon analyzing its mutation energy, it was found that all mutations were neutral, contradicting the experimental results.
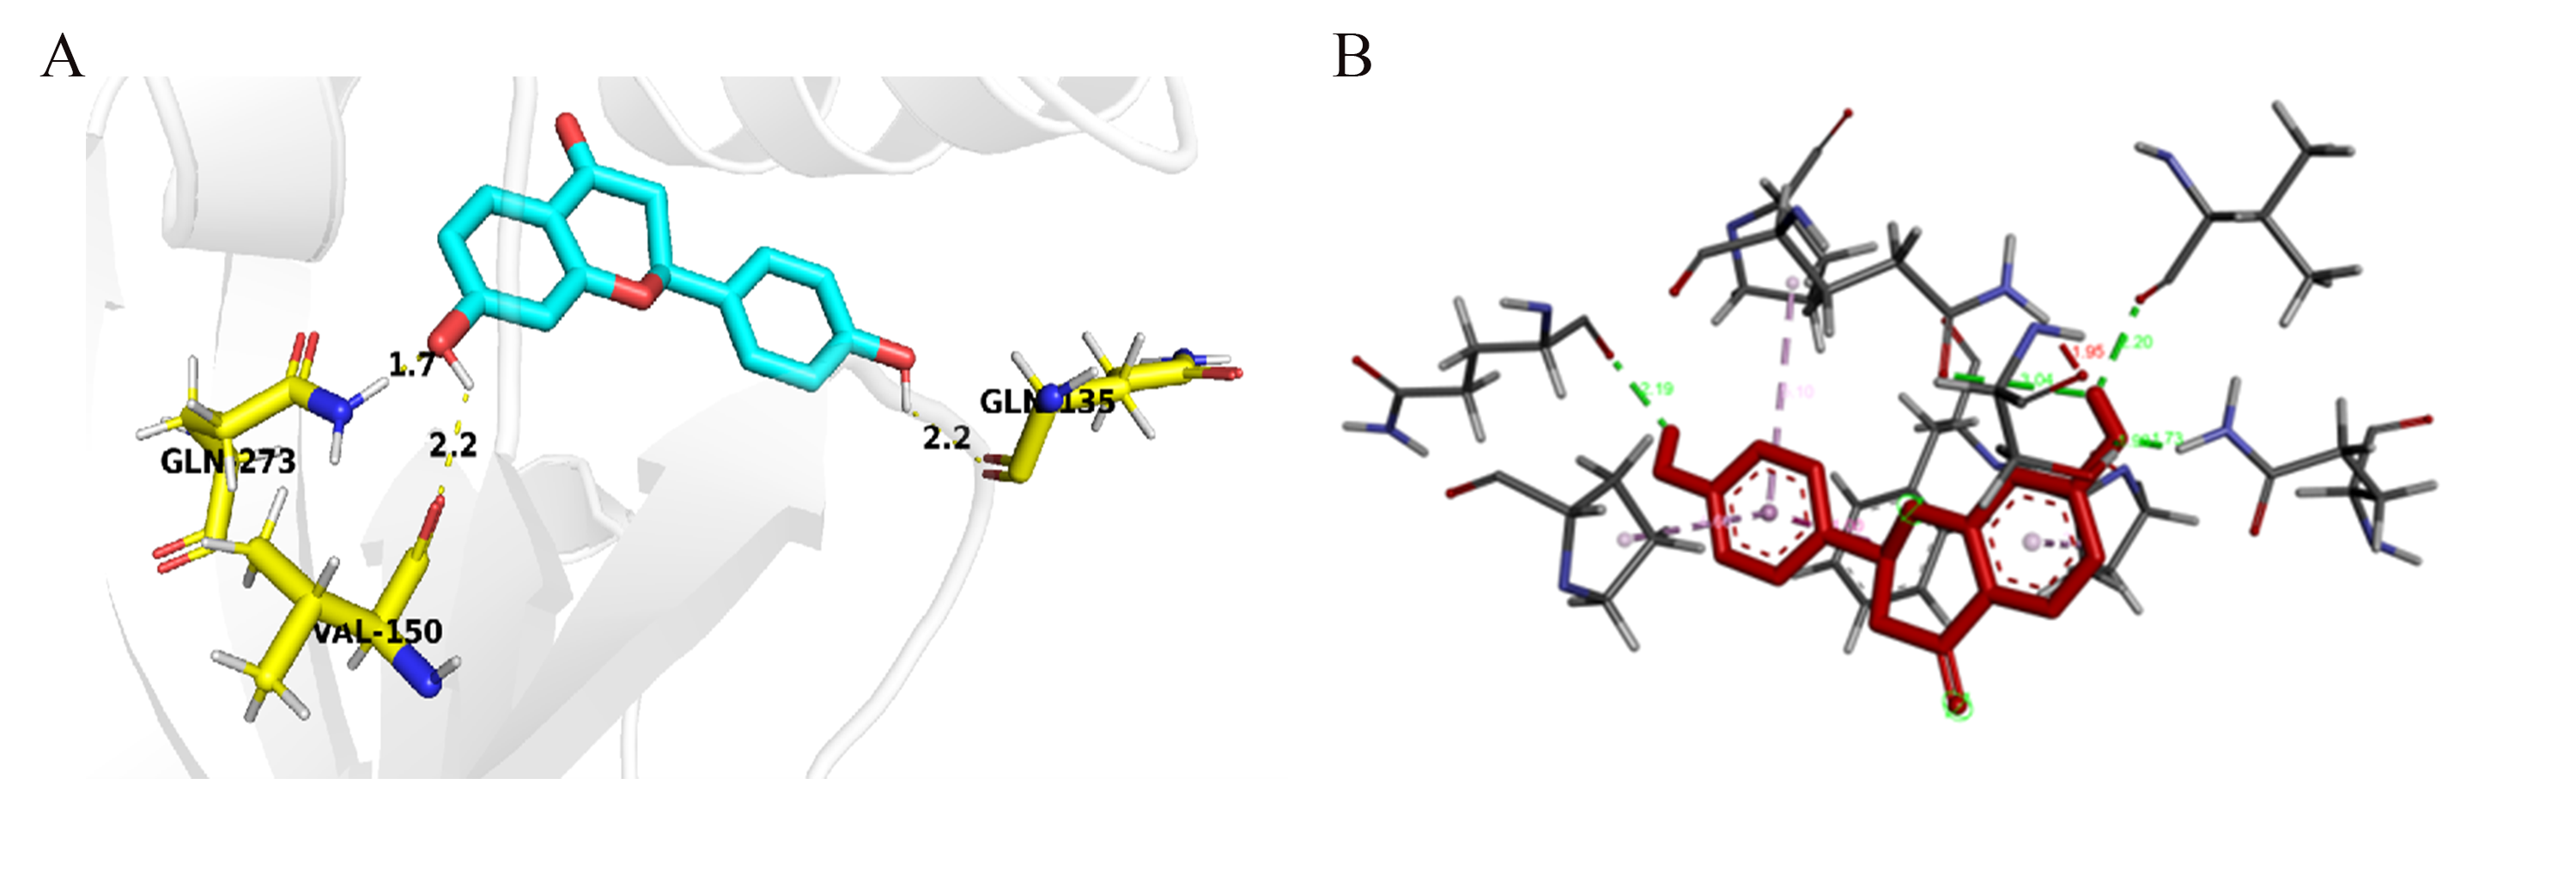
Figure 10. (A) Hydrogen bond interactions between Mut_49 and liquiritigenin. Liquiritigenin and the amino acid residues of Mut_49 that have hydrogen bond interactions are labeled and shown in ball-and-stick model. Yellow dashed lines represent hydrogen bonds, and the numbers on them indicate the hydrogen bond lengths. (B) The intermolecular forces between mutant 49 and liquiritigenin, such as hydrogen bonds and various π bonds, and the bond lengths of each type of bond.
Table 2. Main characteristics of Mut_49 mutation prediction
| Index | Mutation | Mutation Energy (kcal/mol) | Effect |
|---|---|---|---|
| 1 | A: VAL134>LEU | 0.05 | NEUTRAL |
| 2 | A: PHE106>LEU | 0.07 | NEUTRAL |
| 3 | A: PHE106>LEU A: PHE13>LEU |
0.07 | NEUTRAL |
| 4 | A: MET60>LEU | 0.00 | NEUTRAL |
| 5 | A: HIS246>GLU | 0.41 | NEUTRAL |
We then carried out molecular dynamics simulations on the complexes of FdeR with liquiritigenin and Mut_49 with liquiritigenin, respectively.6 The structural changes and the binding between WT and liquiritigenin were investigated by viewing the system potential energy, Rg, RMSD, and interaction energy (Figure 11). MMPBSA analysis was carried out to correlate the MD data with peptide characteristics (Table 3). The interaction energy of the WT was about 15% lower than that of MU, demonstrating that the binding affinity between the WT and the receptor was much higher than the mutant type.
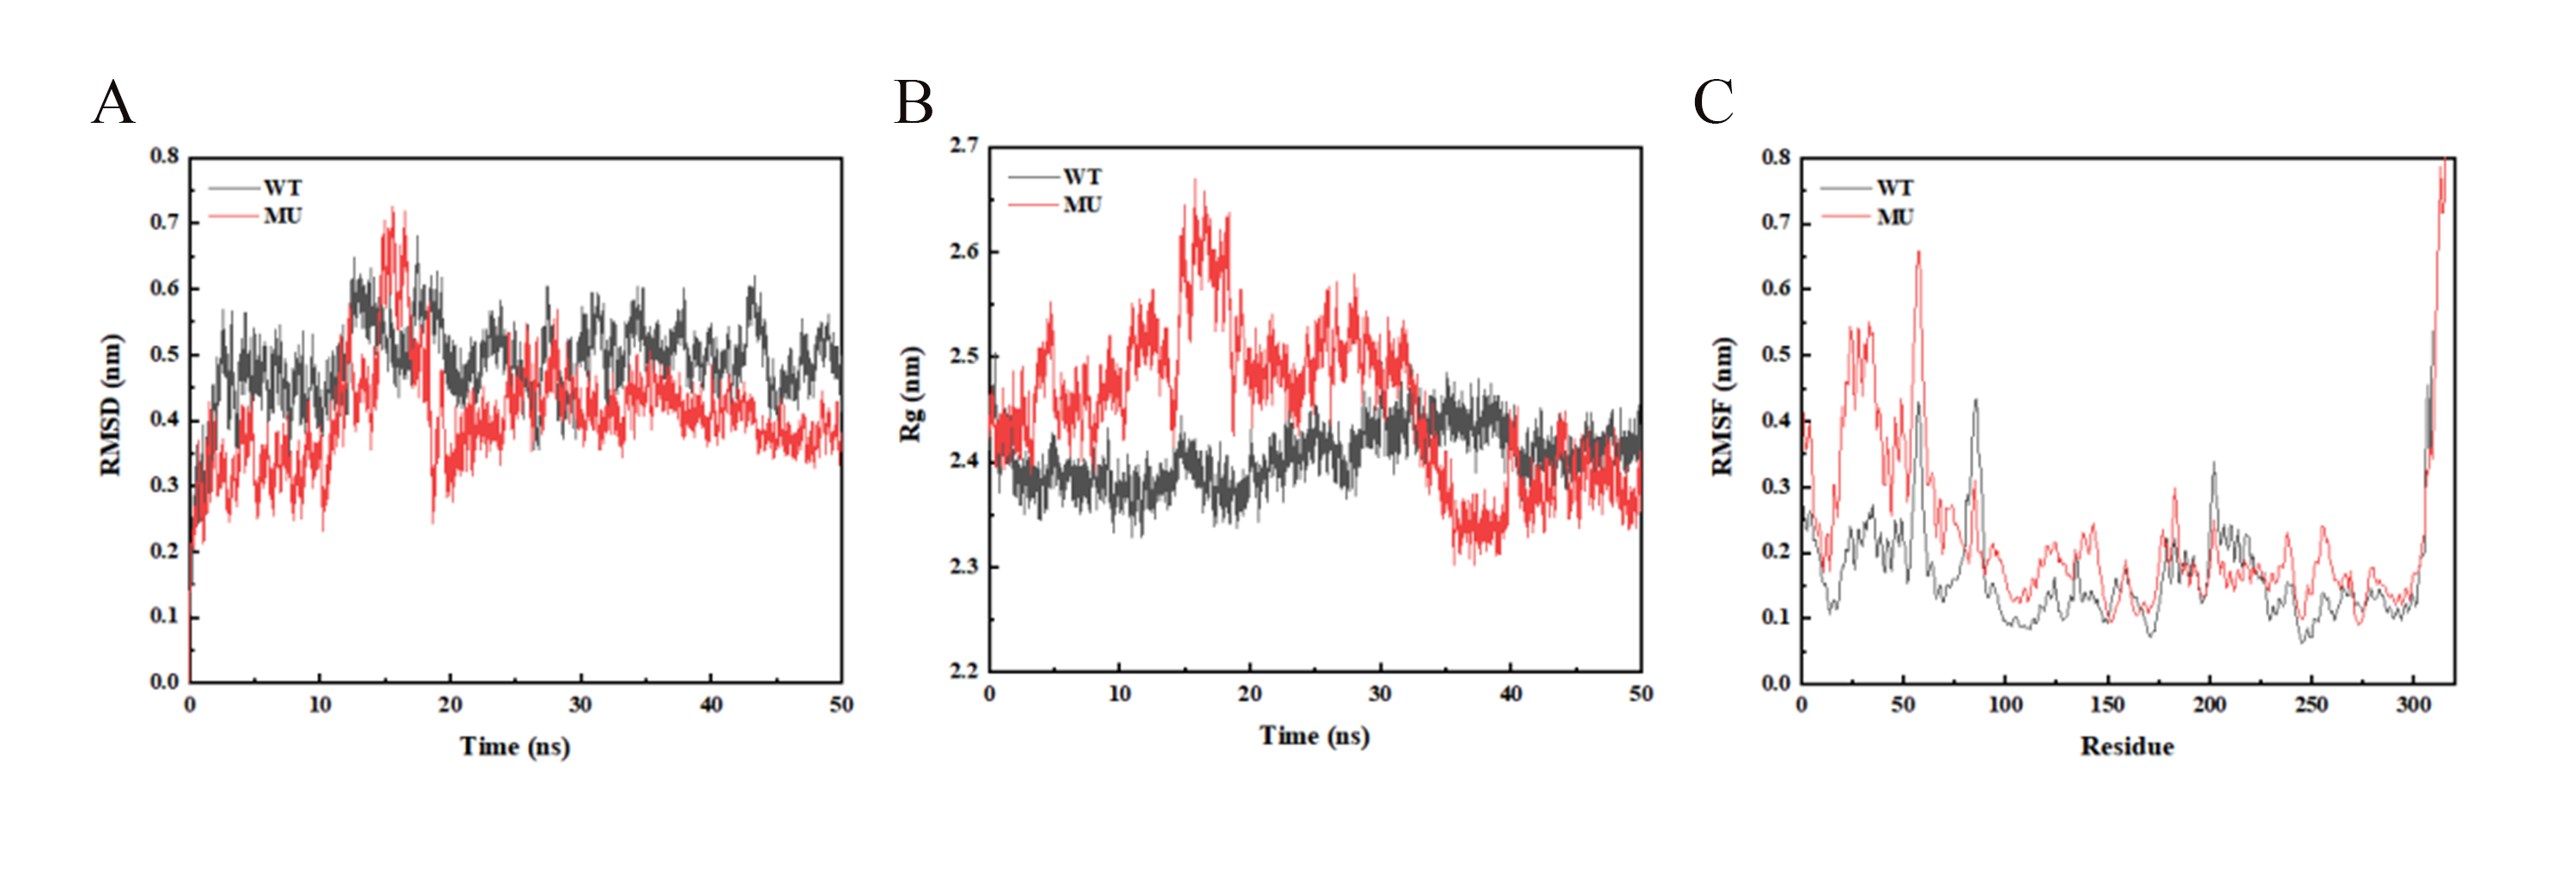
Figure 11. Molecular dynamics trajectory analysis of WT and Mut_49. WT stands for FdeR and MU stands for Mut_49. (A) The RMSD curve of the protein during the protein-ligand complex simulation process (the complex reached equilibrium after 20 ns, indicating that the whole simulation process was stable and reliable); (B) The Rg curve of the protein during the protein-ligand complex simulation process (the radius of gyration (Rg) is used to prove the compactness of the protein structure during the simulation process, it is the distance between the centroid of all atoms and their ends at a specific time interval. During the whole complex MD simulation process, the Rg value fluctuation of MU was larger than that of WT, indicating that WT might bind more tightly with the small molecule); (C) The RMSF curve of the protein during the protein-ligand complex simulation process (the fluctuation of each atom relative to its average position is calculated, which characterizes the average of the structural changes over time, and gives a characterization of the flexibility of each region of the protein. The RMSF value of the protein in the MU-ligand complex group was larger than that of the protein in the WT-ligand complex group in the 0-75 range, indicating that the flexibility of MU was greater than that of WT).
Table 3. Comparison of statistics between WT and MU
| Energy | WT | MU |
|---|---|---|
| Van der Waals Energy (KJ/mol) | -156.689 | -131.048 |
| Electrostatic Energy (kJ/mol) | -29.978 | -7.192 |
| Polar solvation Energy (KJ/mol) | 101.397 | 67.802 |
| Nonpolar solvation Energy (KJ/mol) | -16.180 | -17.227 |
| Total Binding Energy (KJ/mol) | -101.451 | -87.666 |
| T∆S(KJ/mol) | 4.444 | 10.645 |
| Total Binding Free Energy (KJ/mol) | -97.007 | -77.021 |
Note: In order to better explain the interaction energy between the protein and the ligand, we used the gmx_mmpbsa script (https://jerkwin.github.io/gmxtool/) to determine the binding energy of all the protein-ligand complexes at the equilibrium stage. In the MMPBSA method, the total binding energy is decomposed into four independent parts (electrostatic interaction, van der Waals interaction, polar solvation and non-polar solvation interactions).
Currently, we have successfully constructed the plasmids (SP, AP and CP) required for PACE (Figure 12, Figure S13,S14).
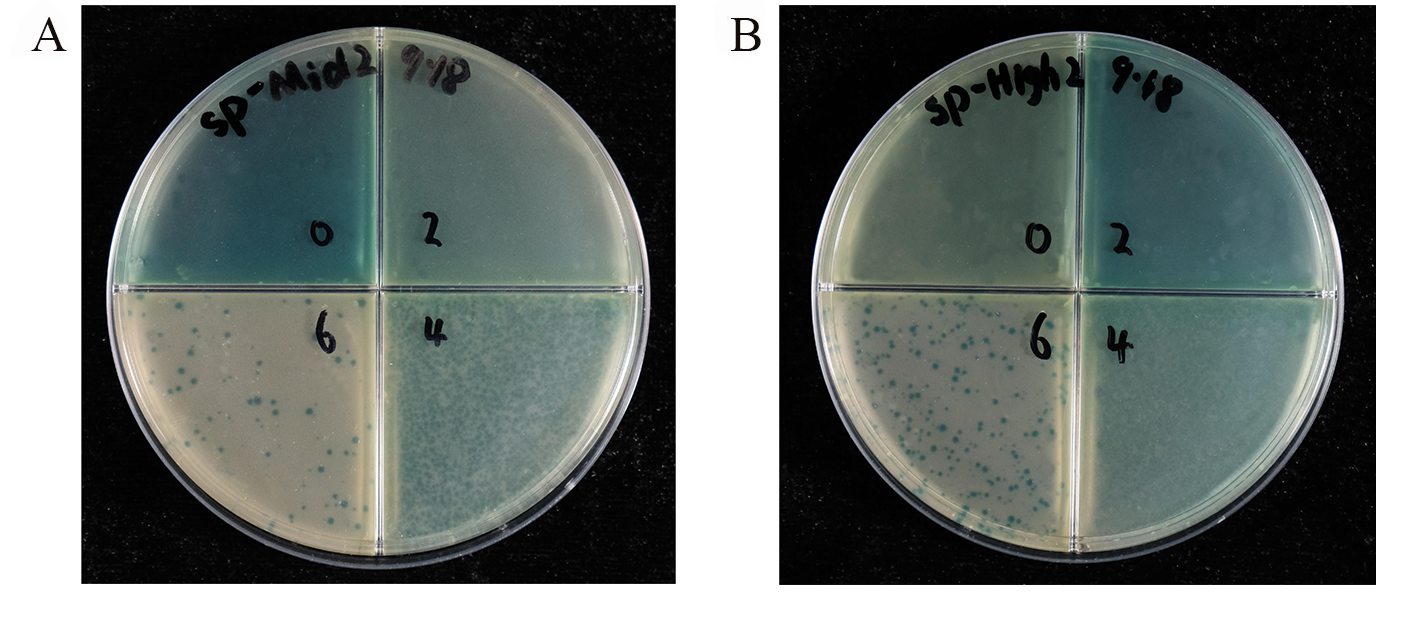
Figure 12. Activity-independent phage plaque assay.(A) SP-Mid2 phage and (B) SP-High2 phage; from the upper right quadrant, upper left quadrant, lower right quadrant, and lower left quadrant, the phage concentrations are 100, 10-2, 10-4, 10-6 in order, and the number of phages in appropriate in quadrants can be used to quantify the titer.
We also successfully built the PACE device, tuned the operational parameters of syringe pumps and peristaltic pumps, as well as the length of needles in the chemostat and lagoons(Figure 13). This ensured the host bacteria maintained a stable cell density and allowed M13 phage propagate normally in the lagoons. The mutation rate μbp of DP6 has been measured as 1.007×10⁻⁵, and the PACE system has been initiated. We will isolate promising individuals from this pool and further test their performance as biosensors.
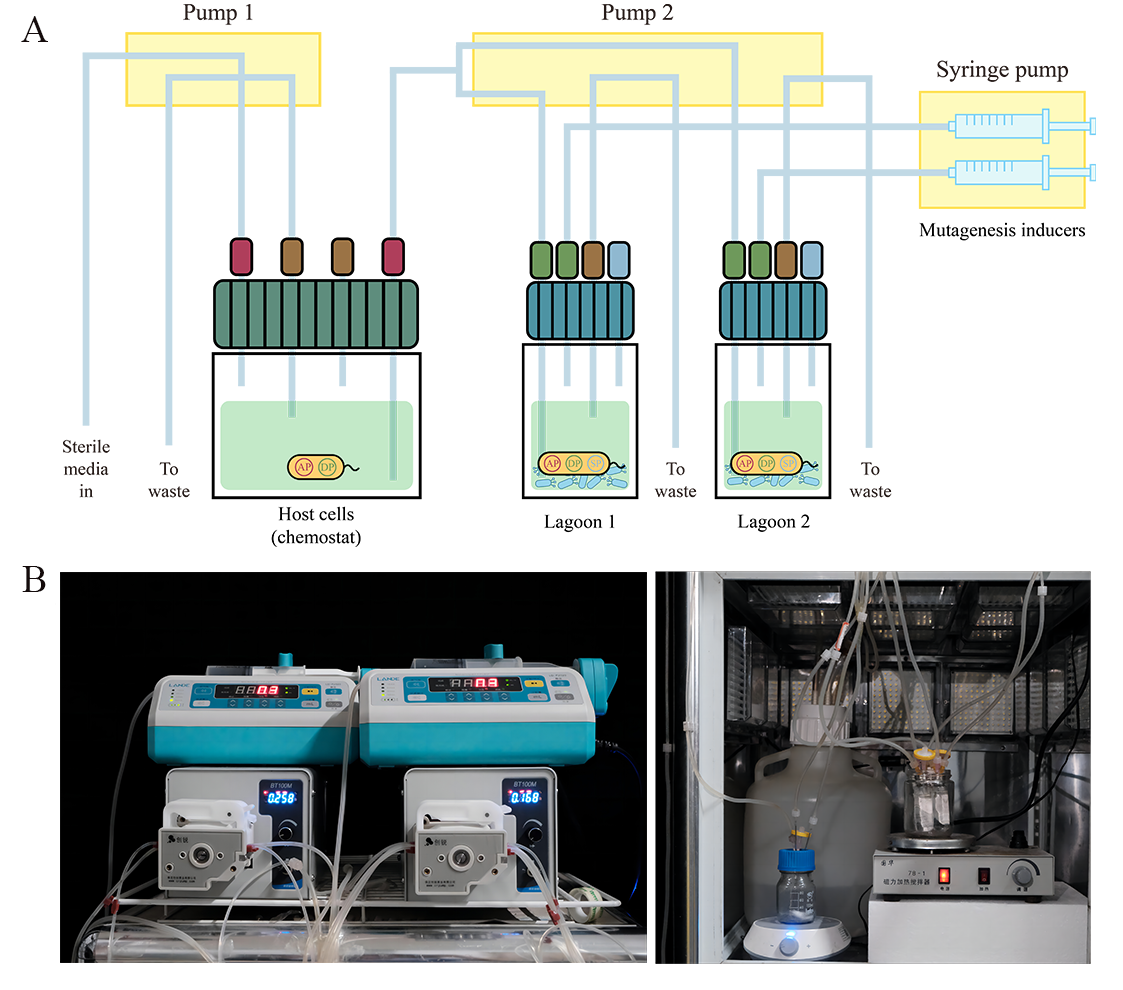
Figure 13. Schematic of the PACE apparatus. Coupled to each other, allowing the phage to continuously cross-seed between the two lagoons. Chemostat. Provide constant cell density for lagoons for M13 bacteriophage infection. Lagoons, Phage infect and propagate. Inducers. Initiate the expression of mutagenic genes to mutate at the genome-wide level of E. coli. (B) Photo of our PACE apparatus. The picture on the left shows syringe pumps(0.3 ml/h) and peristaltic pumps(0.258 ml/min). The picture on the right shows DRM carboy, the chemostat and lagoons.
1. J. Vandierendonck, Y. Girardin P. De Bruyn et al, A Multi-Layer-Controlled Strategy for Cloning and Expression of Toxin Genes in Escherichia coli. Toxins (Basel) 15, (2023).
DOI: http://doi.org/10.3390/toxins15080508
2. T.P. Huang, Z.J. Heins S.M. Miller et al, High-throughput continuous evolution of compact Cas9 variants targeting single-nucleotide-pyrimidine PAMs. Nat Biotechnol 41, 96-107, (2023).
DOI: http://doi.org/10.1038/s41587-022-01410-2
3. G.M. Morris, R. Huey W. Lindstrom et al, AutoDock4 and AutoDockTools4: Automated docking with selective receptor flexibility. J Comput Chem 30 , 2785-91, (2009).
DOI: http://doi.org/10.1002/jcc.21256
4. BIOVIA, Dassault Systèmes, Discovery Studio Visualizer, v21.1.0.20298, San Diego: Dassault Systèmes, 2020.
5. R. Wassem, A.M. Marin A. Daddaoua et al, A NodD-like protein activates transcription of genes involved with naringenin degradation in a flavonoid-dependent manner in Herbaspirillum seropedicae. Environ Microbiol 19, 1030-1040, (2017).
DOI: http://doi.org/10.1111/1462-2920.13604
6. Y. Jiang, J. Gu J. Lei et al, Molecular Dynamics and Bioactivity of a Novel Mutated Human Parathyroid Hormone. Tropical Journal of Pharmaceutical Research 13, 511-518, (2014).
DOI: http://doi.org/10.4314/tjpr.v13i4.4