

Rational Design
Combinatorial Screening of Chassis Strains and High-Yield Plasmids
This study constructed six chassis strains and three plasmids (Table 1).
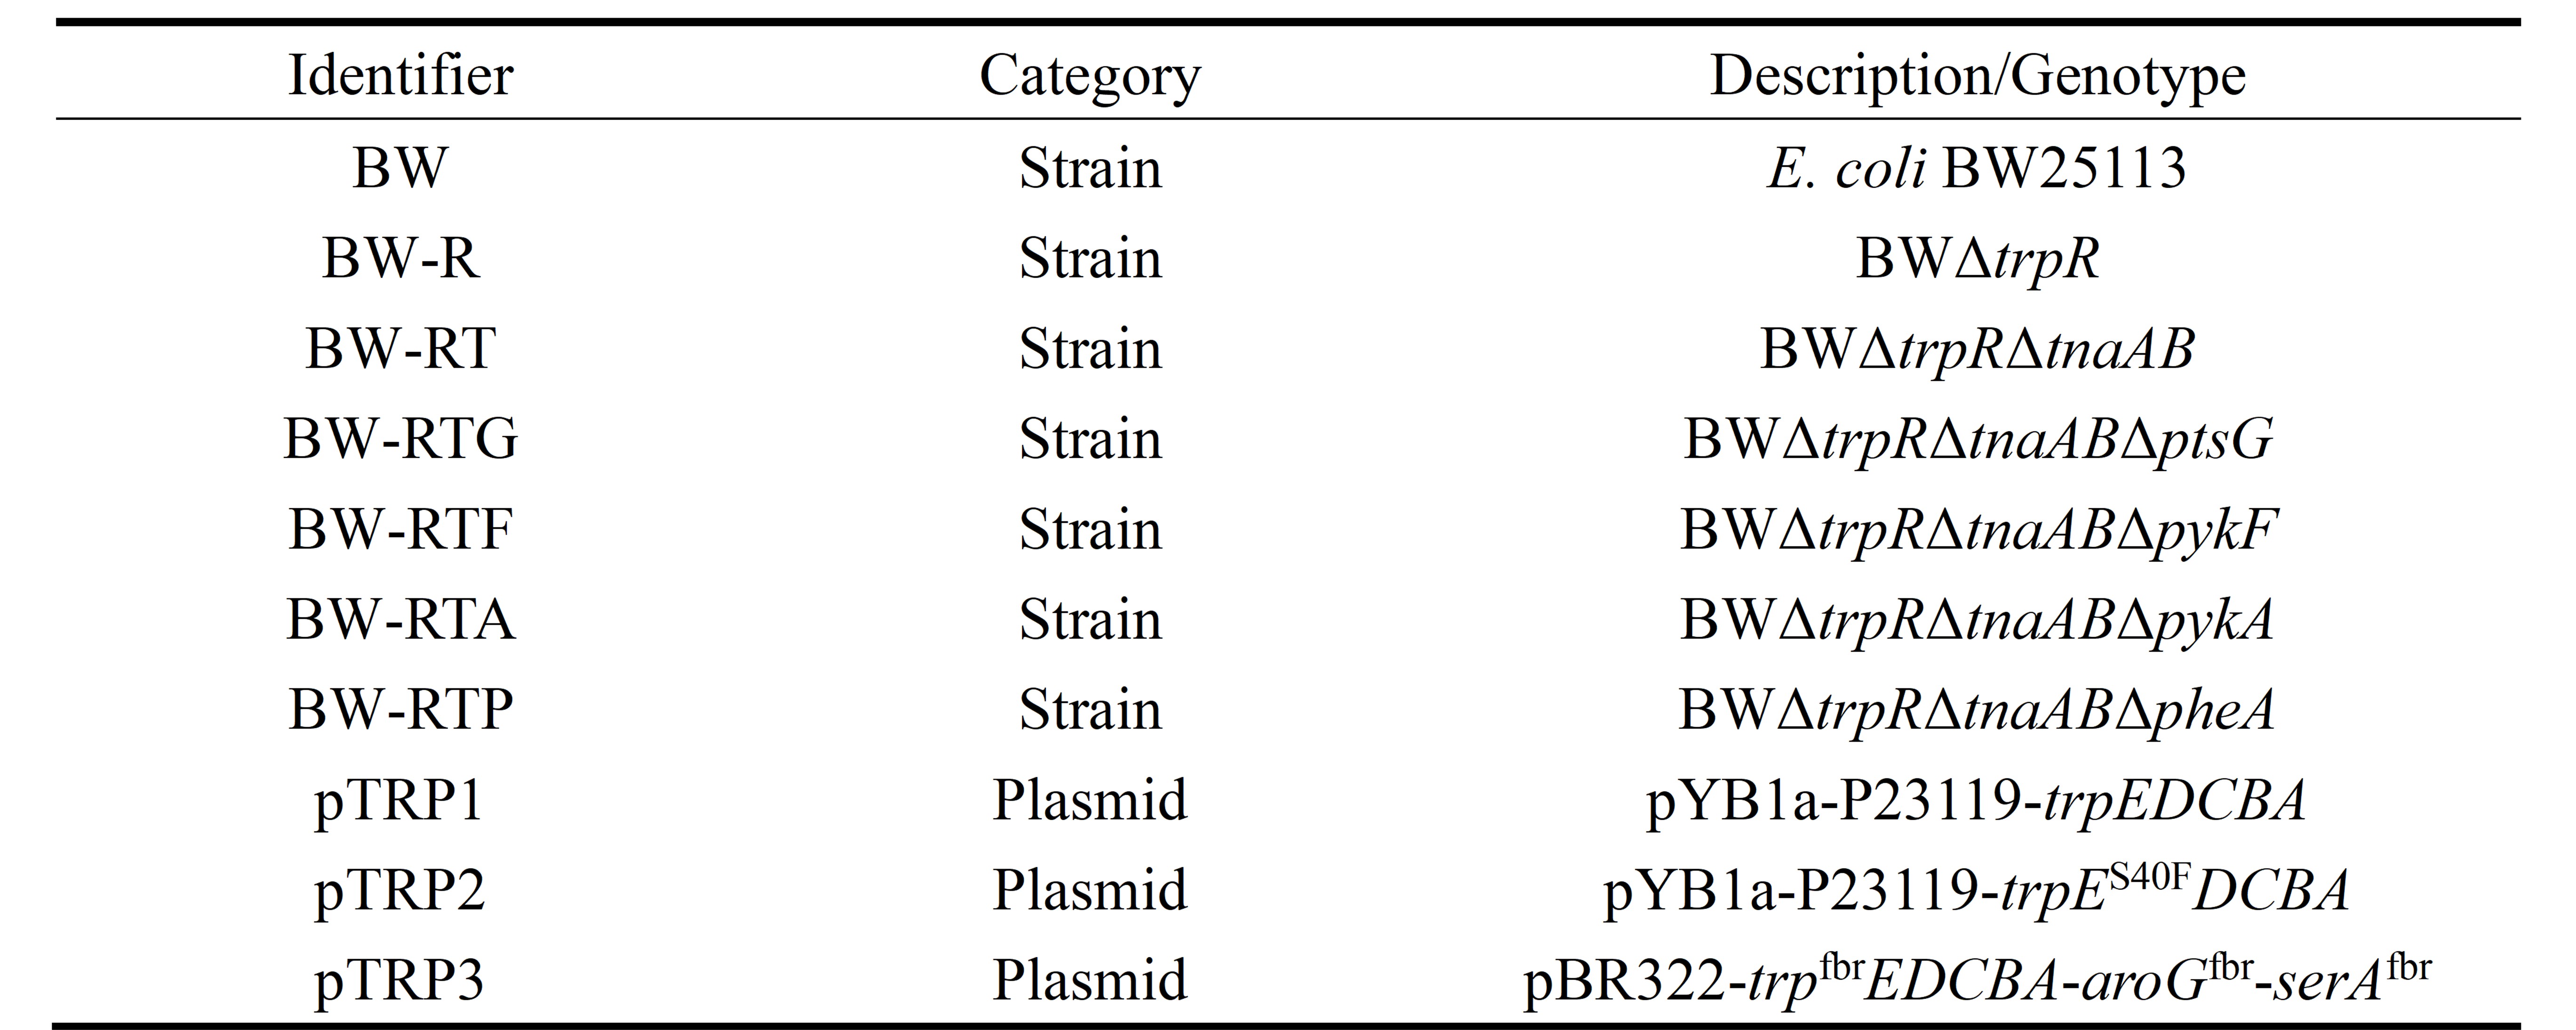
Table 1.Plate strain and plasmid identifier
To enhance the tryptophan production capacity of the strains, each plasmid was transformed into three engineered strains: the wild-type BW25113 (BW), BW-R1 with the transcriptional repressor trpR deleted, and BW-RT2 with simultaneous deletions of trpR and the tryptophan degradation genes tnaAB. The results showed that pTRP3 achieved the highest yield across all strains (Figure 1A). Among them, the BW-RT (pTRP3) combination produced 2.997 g/L of L-tryptophan, indicating that the synergistic effects of transcriptional derepression, blockage of the degradation pathway, and feedback-resistant enzymes effectively improved production.Knockout of Competitive Pathway Genes to Redirect Carbon Flux
Based on the optimal combination BW-RT (pTRP3), we further knocked out genes at multiple competitive metabolic nodes to redirect carbon flux toward L-tryptophan synthesis. The targeted genes included: ptsG3,4, responsible for glucose uptake but consuming the precursor PEP; pykF and pykA5,6, which catalyze the conversion of PEP to pyruvate; and pheA7, which catalyzes the diversion of chorismate toward phenylalanine synthesis. After transforming pTRP3 into the respective chassis strains (BW-RTG, BW-RTF, BW-RTA, BW-RTP), the pheA knockout demonstrated the most significant effect (Figure 1B). The final strain BW-RT pTRP3 achieved an L-tryptophan titer of 3.99 g/L, representing a 22.8% increase over the parent strain BW-RT.
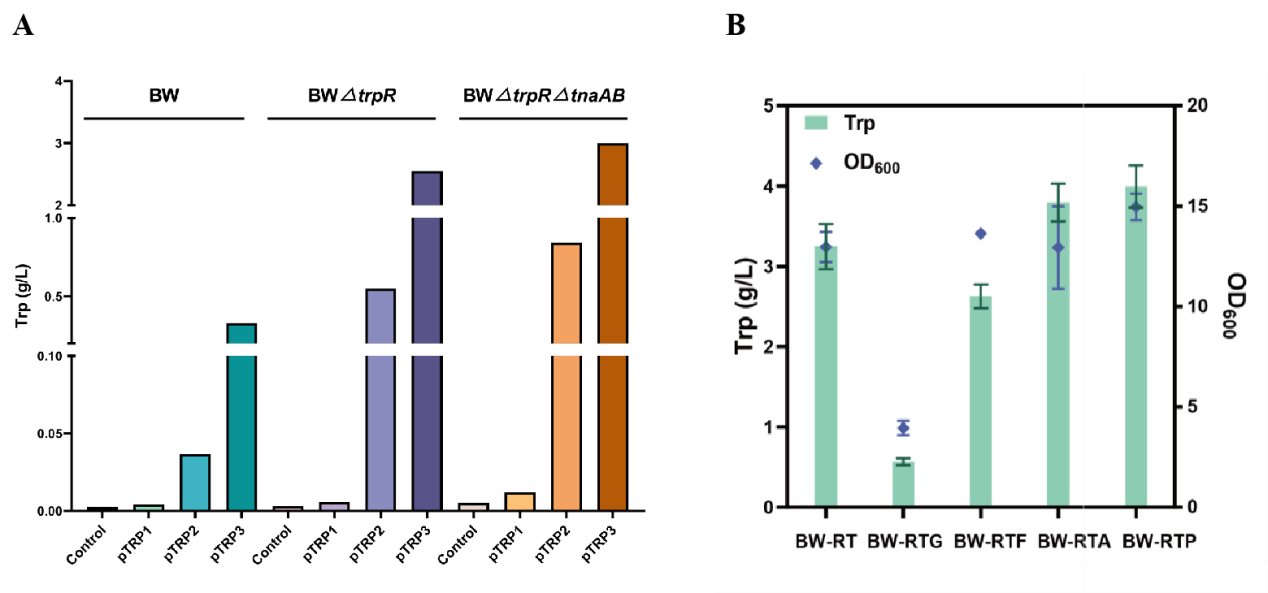
Figure 1.Evaluation of L-Tryptophan production by different engineered strains and the impact of key gene knockouts.(A) Comparison of L-tryptophan production by different chassis strain-plasmid combinations. Plasmids pTRP1, pTRP2, pTRP3, and an empty plasmid control were transformed into strains BW, BW-R, and BW-RT for shake-flask fermentation. (B) Effects of knocking out key metabolic node genes (ptsG, pykF, pykA, pheA) on L-tryptophan production and cell growth (OD600) in the BW-RT strain background.
Development of Tryptophan Biosensors and Screening of Mutants
Construction of Tryptophan Biosensors and Non-Rational Evolution
To efficiently screen for high-yield tryptophan-producing strains, we constructed a biosensor (plb1s-pBAD-tnaC-mCherry-Cmr8) based on the leader peptide of the tryptophan operon. This sensor regulates reporter gene expression according to intracellular tryptophan concentration: at low tryptophan levels, transcription of downstream genes is prematurely terminated; at high tryptophan concentrations, ribosome stalling prevents termination, allowing normal transcription of downstream genes and enabling strain survival under specific chloromycin conditions. Results showed that in the presence of 12 mg/L chloromycin, bacterial growth increased with tryptophan supplementation within the concentration range of 0–1.5 g/L (Figure 2A). Subsequently, we subjected the BWΔtrpRΔtnaAB-pYB1a-P23119-trpES40FDCBA strain to directed evolution under these conditions.
To increase mutation frequency, we introduced the MP6 plasmid, which expresses proteins that reduce DNA replication fidelity under arabinose induction, thereby generating genome-wide random mutations9. We integrated this MP6 mutagenesis system with the aforementioned tryptophan biosensor to establish a high-throughput screening platform. The chassis strain BWΔtrpRΔtnaAB was co-transformed with plasmids MP6-K, pLB1s-PBAD-tnaC-mCherry-Cmr, and pYB1a-P23119-trpES40FDCBA, followed by multiple rounds of evolutionary screening.
Primary screening was conducted in a 3 mL fermentation system. Mutants 3.4 and 10.7 from the 10th round of evolution exhibited approximately 3.25-fold higher tryptophan production compared to the wild-type strain (Figure 2B). Subsequent re-screening in a 15 mL system confirmed that mutants 3.4 and 10.7 showed the most significant production improvement (Figure 2C).
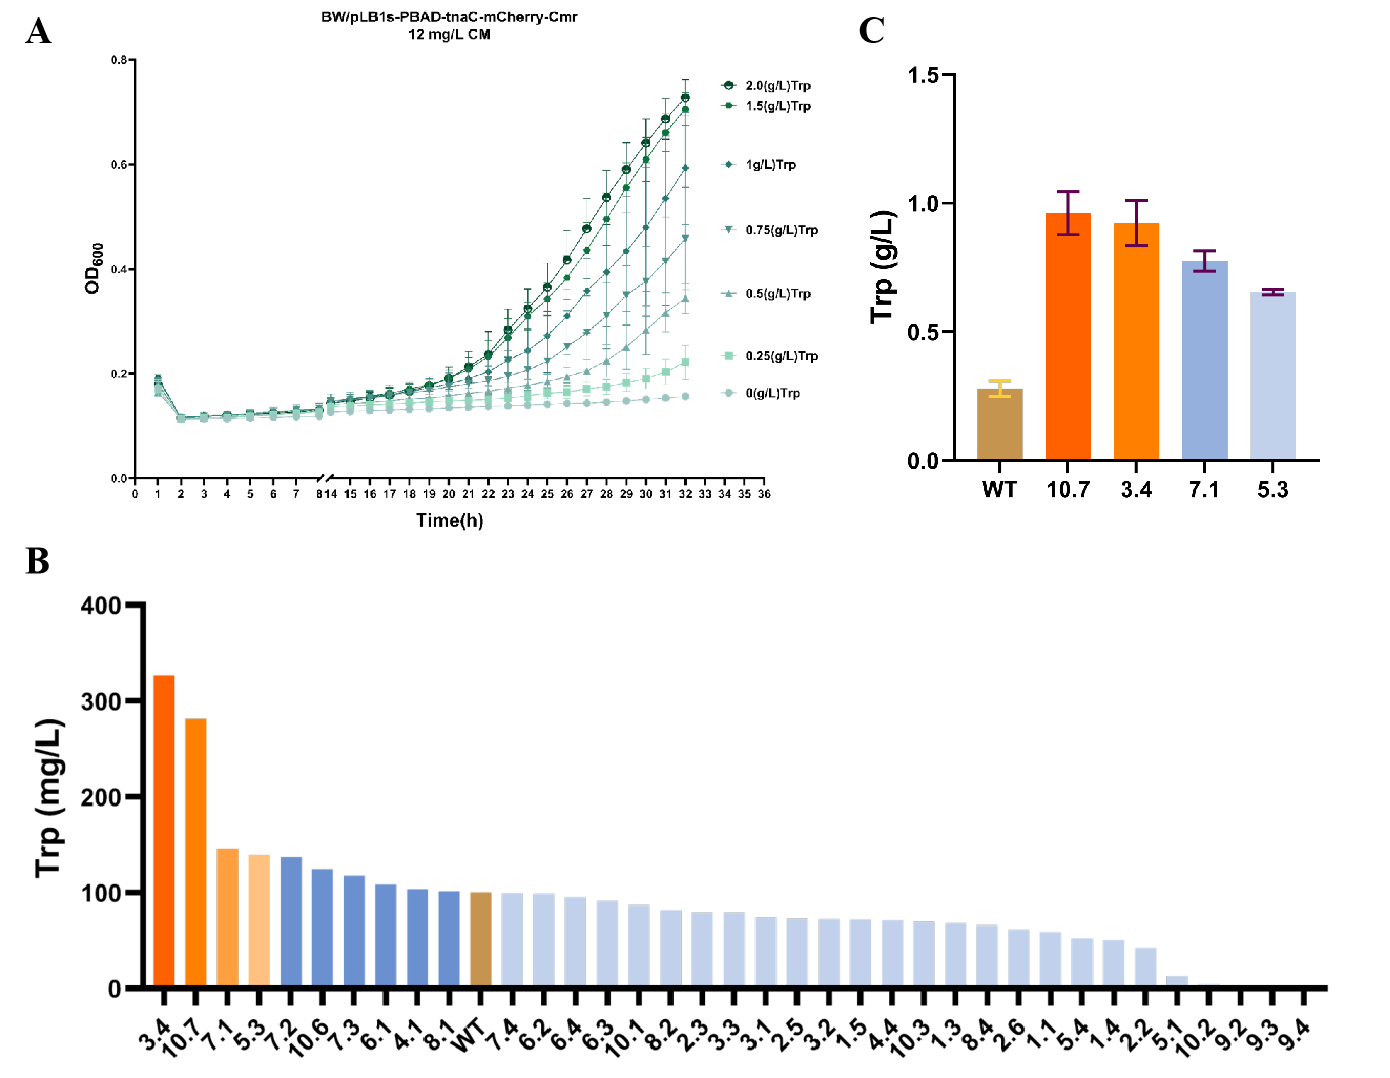
Figure 2. Development of a tnaC-based tryptophan biosensor and non-rational evolutionary design using the MP6 mutagenesis system. (A) Dose-dependent enhancement of bacterial growth with increasing tryptophan concentration (0–1.5 g/L). (B) Initial HPLC analysis indicated that mutants 3.4 and 10.7 exhibited the highest tryptophan production. (C) Repeated fermentation validation confirmed that mutants 3.4 and 10.7 showed significantly increased tryptophan production, reaching approximately 3.25-fold that of the wild-type strain.
Analysis of Whole-Genome Mutations
Identification and Comparison of Genomic Variations
Directed evolution induced significant genomic variations. From strain 3-4 to strain 10-7, the number of single nucleotide polymorphisms (SNPs) increased from 60 to 175, predominantly involving C→T transitions (Figure 3A). These mutations were widely distributed across the entire chromosome (Figure 3C).
Further analysis revealed that strains 3-4 and 10-7 shared 29 identical SNPs. Strain 3-4 contained 25 unique mutations, while strain 10-7 carried 140 unique mutations (Figure 3B), indicating that they developed distinct phenotypic trajectories for high production during the evolutionary process.
Figure 3. Analysis of genomic variations in wild-type and evolved strains based on whole-genome sequencing.(A) Quantitative statistics of different SNP types. Strain 10-7 exhibited a significantly higher total number of SNPs compared to strain 3-4, with C→T transitions being the predominant type, consistent with the mutational signature of directed evolution. (B) Venn diagram of shared and unique SNPs between the two strains. The presence of 29 shared mutations, along with 25 unique to strain 3-4 and 140 unique to strain 10-7, reflects their adoption of distinct genetic strategies in adapting to the high-production phenotype. (C) Circos plot illustrating chromosomal mutation distribution. The widespread mutation patterns suggest global genetic alterations occurred during evolution. The concentric circles (from outermost to innermost) represent: SNP density of strain 10-7, SNP density of strain 3-4, InDel locations in strain 10-7, and InDel locations in strain 3-4.
Functional Enrichment Analysis Reveals Distinct Evolutionary Strategies
Functional enrichment analysis elucidated the molecular basis of the high-production phenotype. Analysis of shared mutant genes revealed significant enrichment in tryptophan and aromatic amino acid biosynthesis pathways, indicating direct enhancement of the core biosynthetic route during evolution (Figure 4A).
Unique mutations in strain 3-4 were predominantly associated with RNA metabolism and related processes, suggesting its high production was achieved through optimization of information processing and metabolic regulation (Figure 4B). In contrast, unique mutations in strain 10-7 were primarily localized to membrane biogenesis and transmembrane transport functions, implying that its high production relied more heavily on enhanced cellular structure and substance transport (Figure 4C).
These differences demonstrate that the two strains adopted distinct evolutionary strategies: 3-4 favored systemic regulation, while 10-7 emphasized structural function reinforcement.
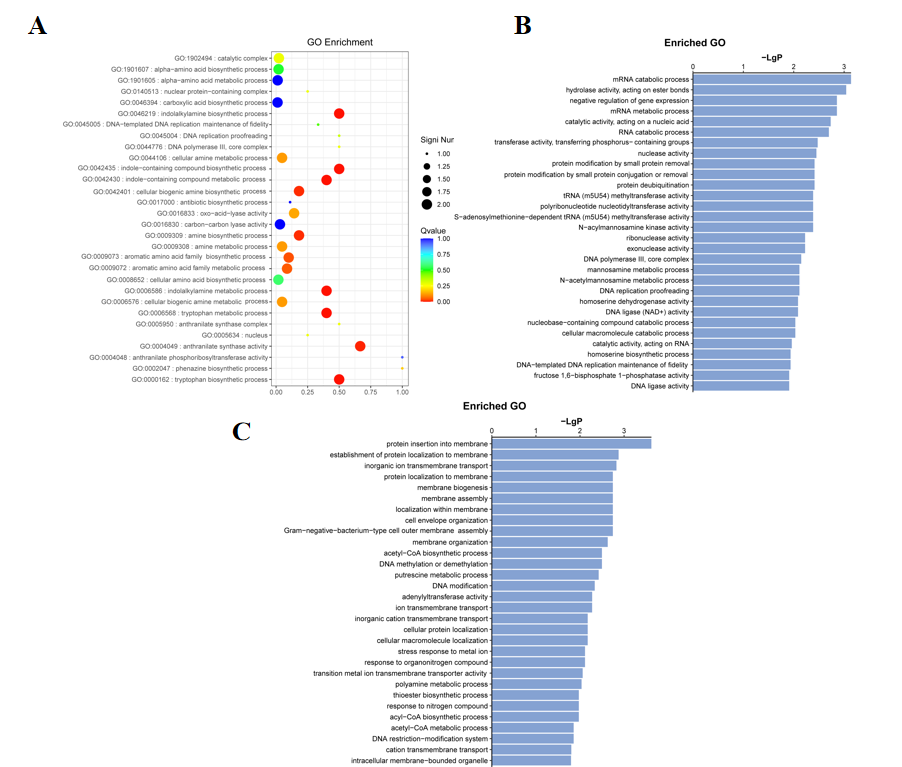
Figure 4. GO enrichment analysis of genomic variations in evolved strains.(A) Bubble plot of GO enrichment for mutations shared by both strains. Bubble size represents the number of genes, and color intensity (red) indicates the level of significance. (B) Bar plot of GO enrichment for mutations unique to strain 3-4. Significant terms are associated with RNA metabolism, regulation of gene expression, and related processes. (C) Bar plot of GO enrichment for mutations unique to strain 10-7. Enriched functions are primarily associated with membrane-related processes and ion transport.
Genetic-Level Strategies for Tryptophan Production
GO analysis indicated that shared mutations in the trpD and trpE genes may have enhanced the core tryptophan biosynthesis pathway. In strain 3-4, mutations in genes such as ligA and pnp potentially improved the supply of reducing equivalents and degradation of competitive mRNAs, respectively, thereby reinforcing metabolic regulation. In strain 10-7, mutations in genes including rhtC and tyrR likely promoted amino acid export and relieved precursor synthesis inhibition, respectively, enhancing transport capacity and precursor supply (Table 2)10,11,12,13,14.
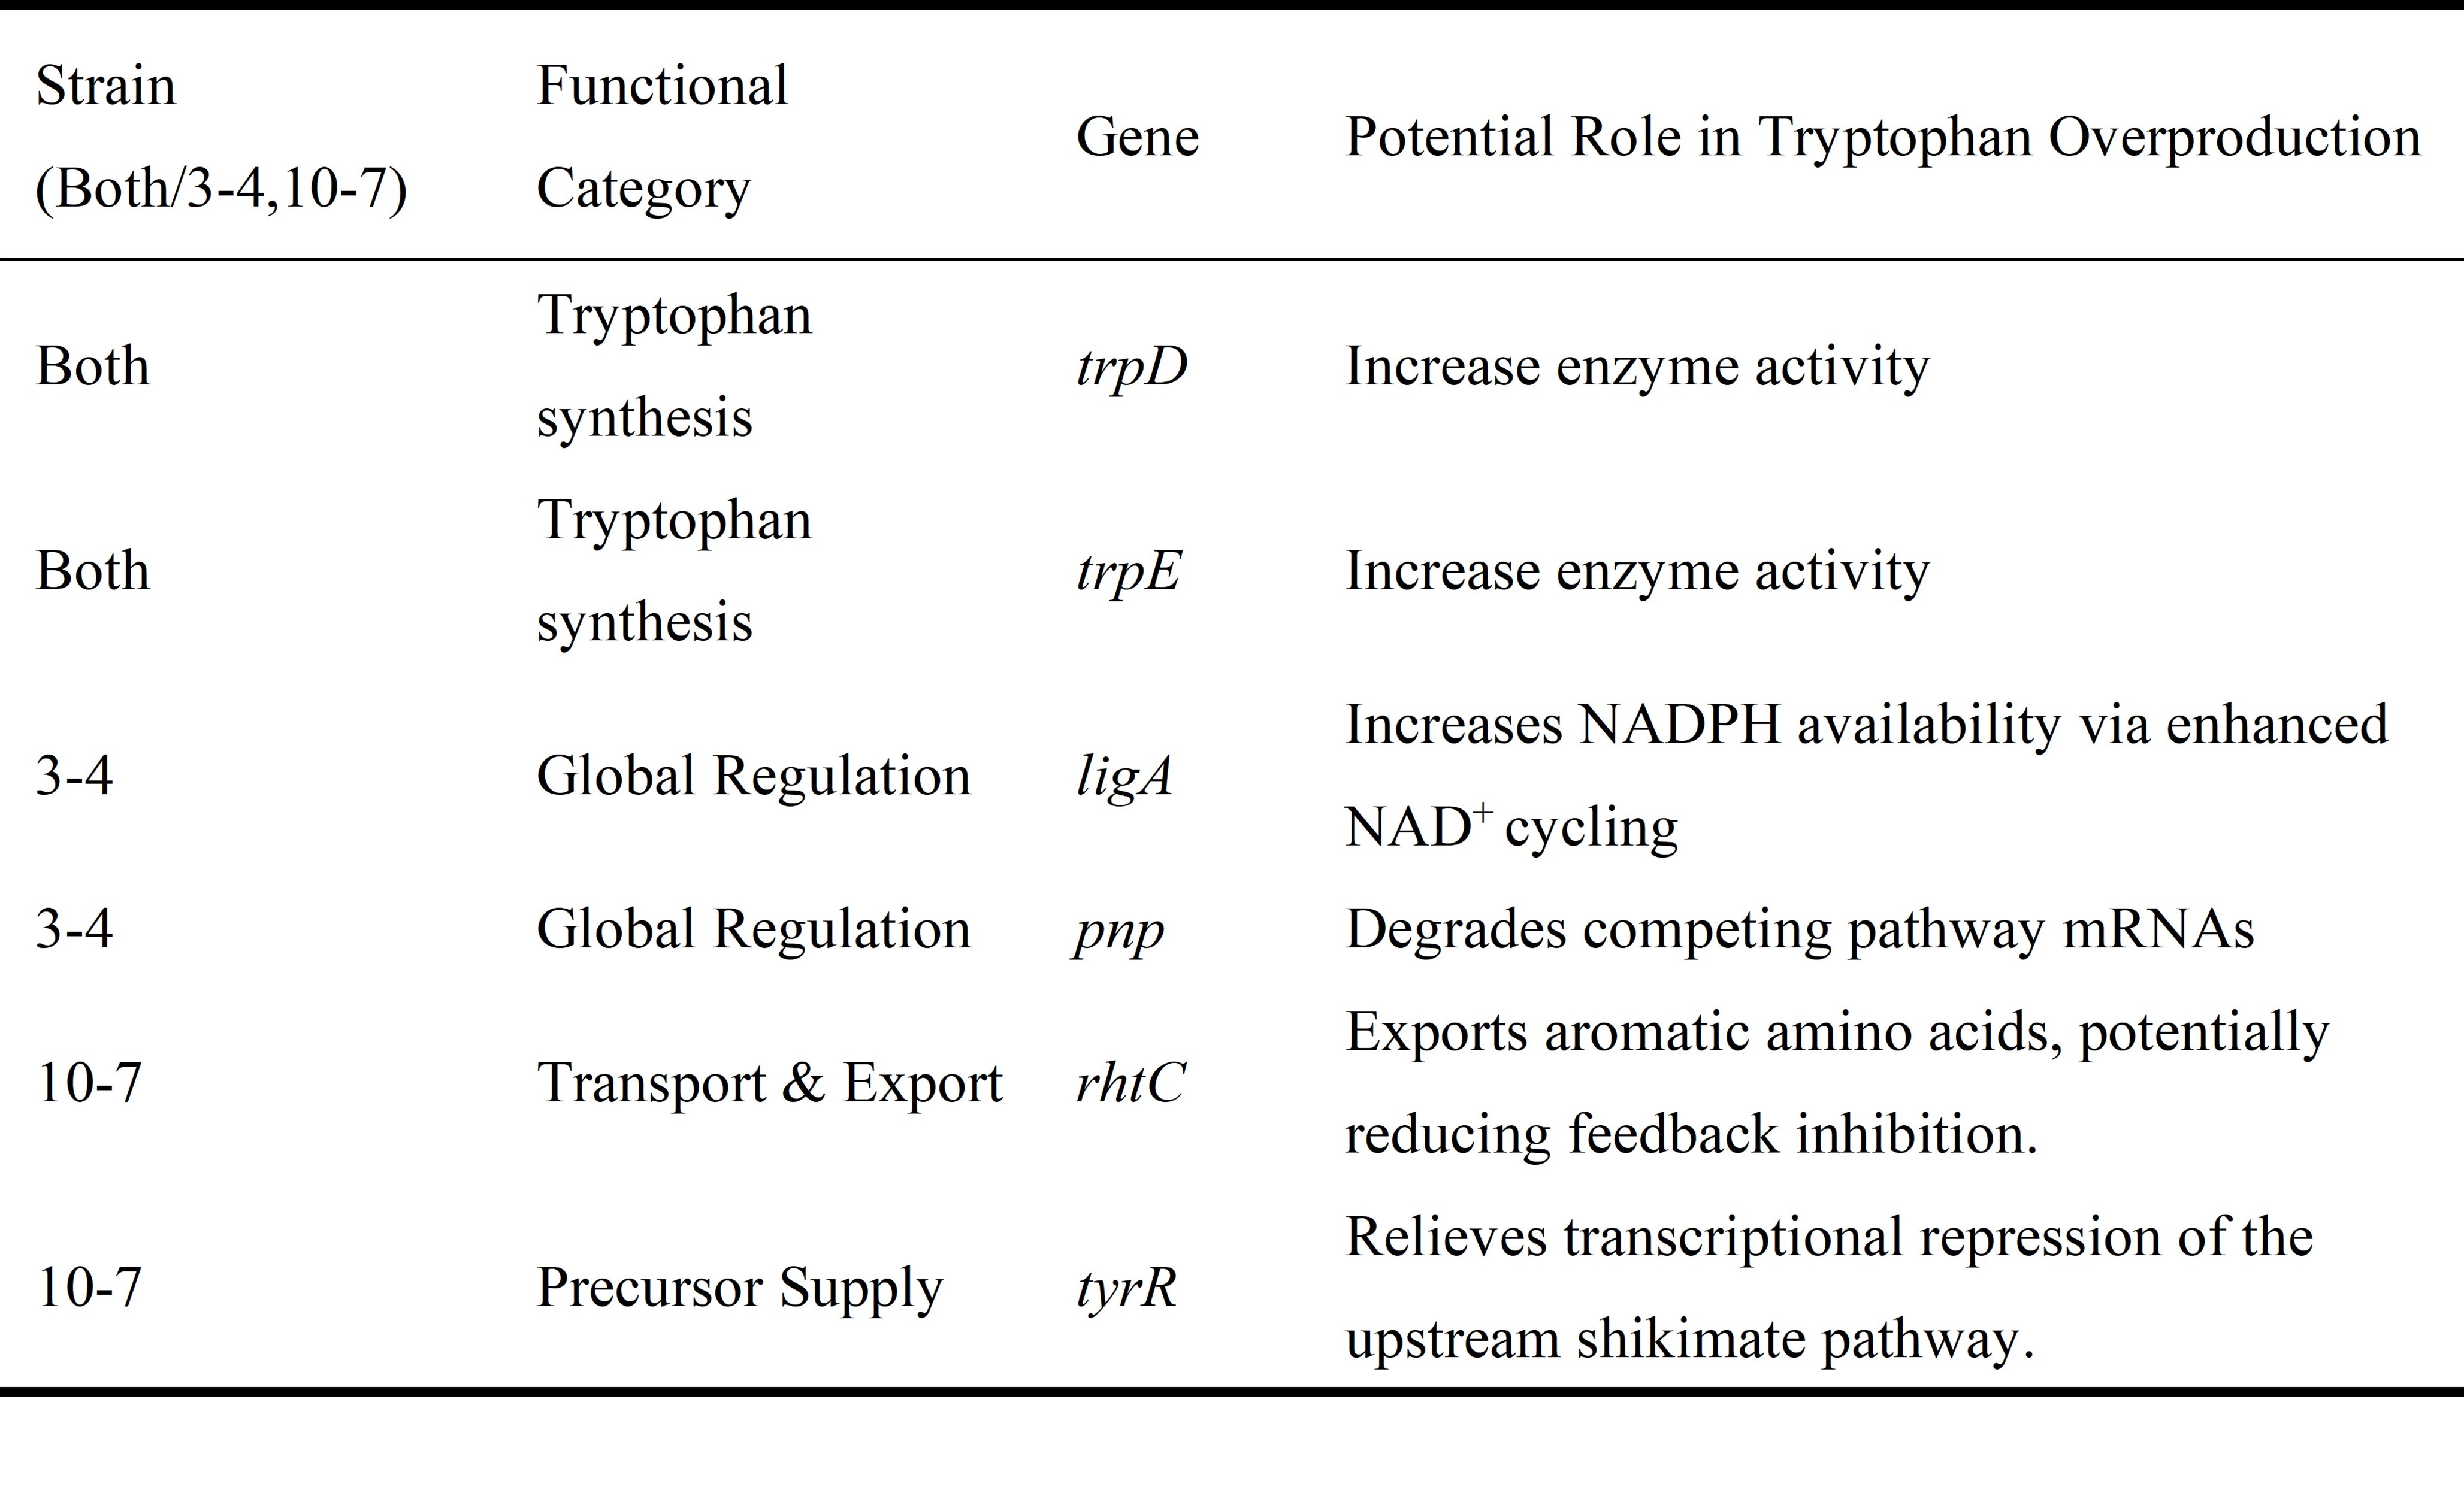
Table 2. Potential Contributions of Key Gene Mutations to Tryptophan Overproduction
Development and Testing of a Homocysteine Biosensor
Construction of the Tryptophan-Melatonin Pathway and Individual Enzyme Activity Assays
Based on the previously obtained high-yield tryptophan-producing E. coli strain, we established a biosynthetic pathway for melatonin production from tryptophan. The catalytic efficiencies of four key enzymes—DjTPH, CrTDC, SgAANAT, and AtCOMT—were evaluated15,16,17,18. Results showed that AtCOMT exhibited significantly lower substrate conversion rates, prompting the adoption of a directed evolution strategy to enhance its activity.
Construction and Validation of a Homocysteine Biosensor
We developed a cysteine-dependent biosensor that couples AtCOMT activity with E. coli growth19. In this system, bacterial survival depends on AtCOMT-catalyzed conversion of SAM to SAH, followed by homocysteine generation; insufficient enzyme activity results in growth impairment. Exogenous homocysteine supplementation restored growth in a concentration-dependent manner, while the non-supplemented group failed to grow (Figure 5A), confirming the functional integrity of the biosensor.
Further comparison between wild-type AtCOMT and the high-activity mutant (AtCOMT*)20 revealed that the mutant increased optical density by approximately 5-fold after 50 hours (Figure 5B), demonstrating the sensor's capacity to effectively discriminate enzymatic activity variations and establishing a reliable platform for subsequent applications.
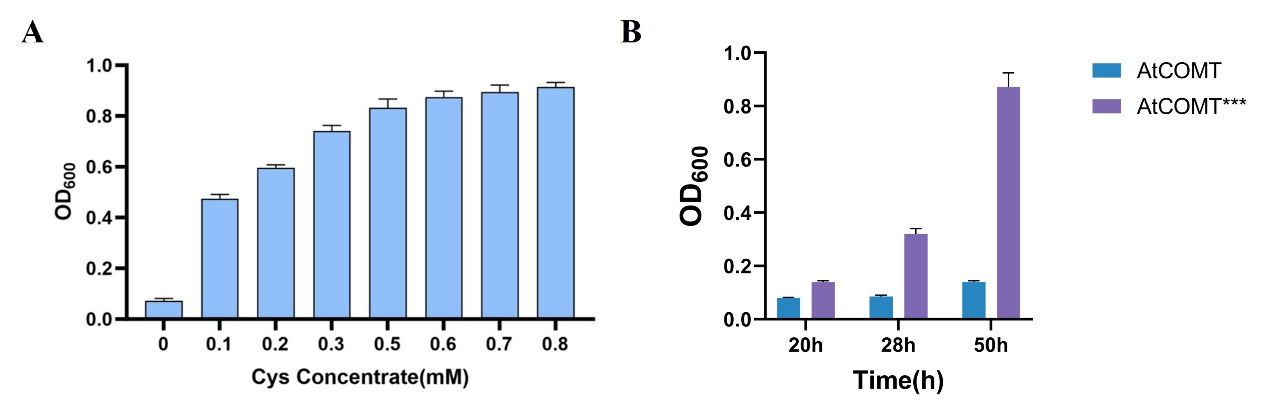
Figure 5. Development and validation of a homocysteine auxotrophic whole-cell biosensor.(A) Growth of E. coli was measured 16 h after exogenous supplementation with different homocysteine concentrations. Bacterial growth improved with increasing homocysteine concentrations, while the strain failed to grow in the absence of homocysteine, confirming its homocysteine auxotrophy. (B) The AtCOMT* strain exhibited significantly better growth than the wild-type, demonstrating a positive correlation between sensor response and enzyme activity.
Mutant Selection
Screening of AtCOMT Mutants Using the Whole-Cell Biosensor
After validating the reliability of the homocysteine auxotrophic biosensor, we employed it to screen for AtCOMT mutants with enhanced enzymatic activity. The known AtCOMT*** mutant C296F-Q310L-V314T, which exhibits 9.5-fold higher activity than the original strain, was used as the template.
We constructed an AtCOMT mutant library containing 2–3 amino acid substitutions via error-prone PCR and cloned it into the pYB1a vector, which was then transformed into E. coli DH5α. Mixed plasmids were extracted and subsequently transformed into the homocysteine auxotrophic chassis strain BWΔCysE-pLB1s-Cys3-Cys4 for growth advantage-based screening using the biosensor.
Screening results and enzyme activity verification
After two rounds of screening and melatonin detection, 27 out of 40 clones in the first round had higher activity than the AtCOMT template, and 11 out of 32 clones in the second round performed better (Figure 6). To exclude the influence of the auxiliary plasmid pLB1s-Cys3-Cys4 on the enzyme activity assay, the plasmid of the optimal mutant selected was re-transformed into the wild-type BW25113 and BWΔCysE strains for verification.
The results showed that even after removing the auxiliary plasmid, the mutant still maintained high activity in both backgrounds, and the enzyme activity of the optimal mutant increased by approximately 84% compared with the original template (Figure 7).
The above results indicate that high-activity mutants of AtCOMT were successfully screened using a cysteine auxotrophic biosensor, which solved the problem of insufficient enzyme activity in the MT synthesis pathway and laid a foundation for subsequent studies on the enzymatic mechanism.
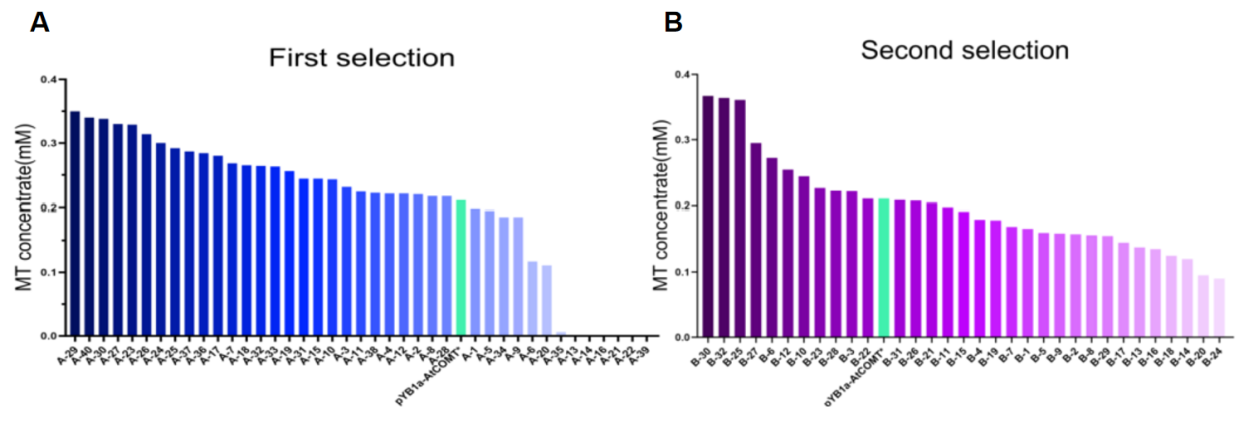
Figure 6. Results of AtCOMT mutant screening. (A) Among the 40 strains screened in the first round, 27 had higher activity than the original template AtCOMT***. (B) Among the 32 strains screened in the second round, 11 had higher activity than AtCOMT***.
After removing the auxiliary plasmids from the top 5 highly active strains obtained through two rounds of screening, the enzyme activities were detected in BW25113 and BWΔCysE, respectively. The results showed that the activity of the optimal AtCOMT mutant was approximately 84% higher than that of the existing highly active strain.
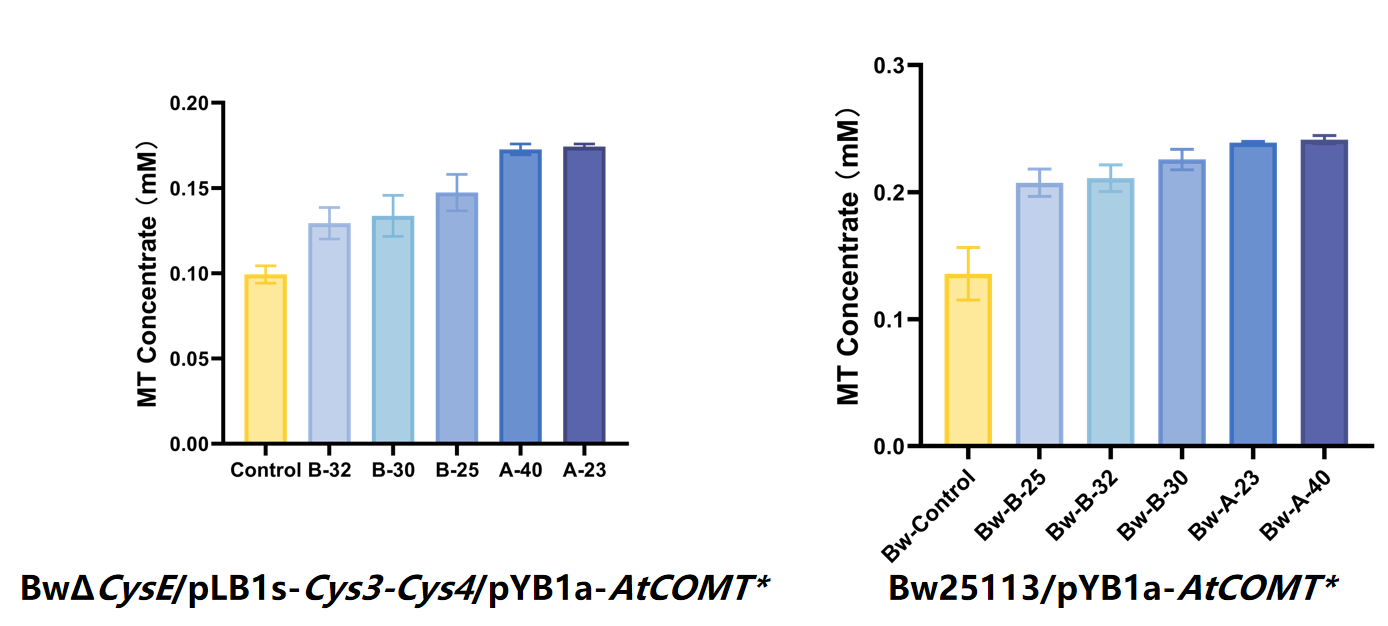
Figure 7. Selection results of AtCOMT mutants.After eliminating the pLB1s-Cys3-Cys4 plasmid from the five strains exhibiting the highest enzyme activity in two rounds of screening, reassessment was performed in both BW25113 and BWΔcysE strains. The results demonstrated that the selected highest-activity AtCOMT* mutant showed an approximately 84% improvement compared to the existing highest-activity template.
Analysis of Screening Results
Molecular docking and HPLC analyses revealed a clear correlation between catalytic efficiency and binding stability in AtCOMT*** (Figure 8A) and its mutant AtCOMT(K187R C296F Q310I V314T) (Figure 8B). The wild-type exhibited a more optimal catalytic conformation, with a shorter reaction distance between its active site His267 and the substrate NAS. In contrast, the mutant demonstrated stronger binding stability and a lower binding energy (-6.2 kcal/mol vs. -5.9 kcal/mol).
Although the catalytic distance slightly increased in the mutant, its substrate binding affinity was significantly enhanced (ΔG decreased by 0.3 kcal/mol), thereby improving the overall catalytic efficiency. These results indicate that in this mutant, the contribution of enhanced binding affinity to catalytic efficiency outweighs that of local optimization of the catalytic conformation, highlighting the critical role of substrate binding stability in regulating enzymatic activity.
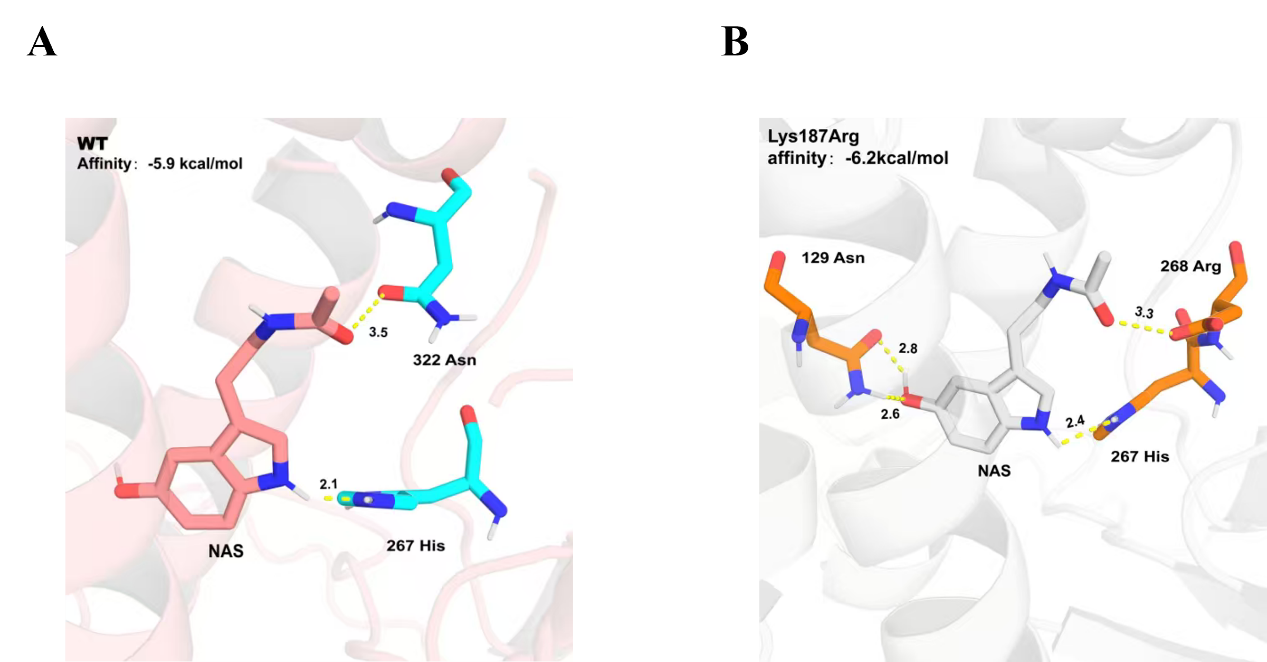
Figure 8. Molecular docking results. (A) AtCOMT*** Distance between His267 and NE2: 2.1Å, Affinity: -5.9 kcal/mol. (B) AtCOMT (K187R C296F Q310I V314T) Distance between His267 and NE2: 2.4Å, Affinity: -6.2 kcal/mol.