Construction of hmaS Mutant Library
Based on error-prone PCR, we used a low-fidelity DNA polymerase and adjusted Mn2+ and Mg2+ concentrations and ratio to manipulate the mutation rate. We determined the final concentrations of 0.02 mM Mn2+ and 0.5 mM Mg2+ for mutagenesis and achieved a mutation rate of 2 mutations/kb, producing a high variety of mutations. We optimized the Golden Gate assembly procedure to increase the probability of inserting mutated fragments into the vector. Eventually, we constructed a mutant library containing 105 clones (Fig. 1) and the rate of positive clones was 100%.

Figure 1. A mutant library with 10⁵ clones was constructed by using a low-fidelity DNA polymerase, determining the concentrations of 0.02 mM Mn2+ and 0.5 mM Mg2+and the optimized Golden Gate assembly procedure.
Construction and Test of a Dual-Module Screening Platform
Functional Testing
We used bacteria harboring the Bio177 plasmid to simulate the scenario of low activity, and bacteria containing the gY9s-HmaS-Bio177 plasmid for high enzyme activity to test the functionality of dual-module screening platform. Both strains were spread on selection plates containing 0.01, 0.05 and 0.1 mg/L 5-FC to simulate the screening process under stress conditions (Fig. 2). We found that, in medium with 0.01 mg/L 5-FC, all 10 randomly selected clones were verified as positive by colony PCR, yielding a 100% selection rate to distinguish desirable hmaS-containing clones from others. Under condition of 0.05 mg/L 5-FC, the growth of the wild-type HmaS strain was inhibited, resulting in a reduced colony number on the plate. Ultimately, the WT strain could not grow under 0.1 mg/L 5-FC condition.
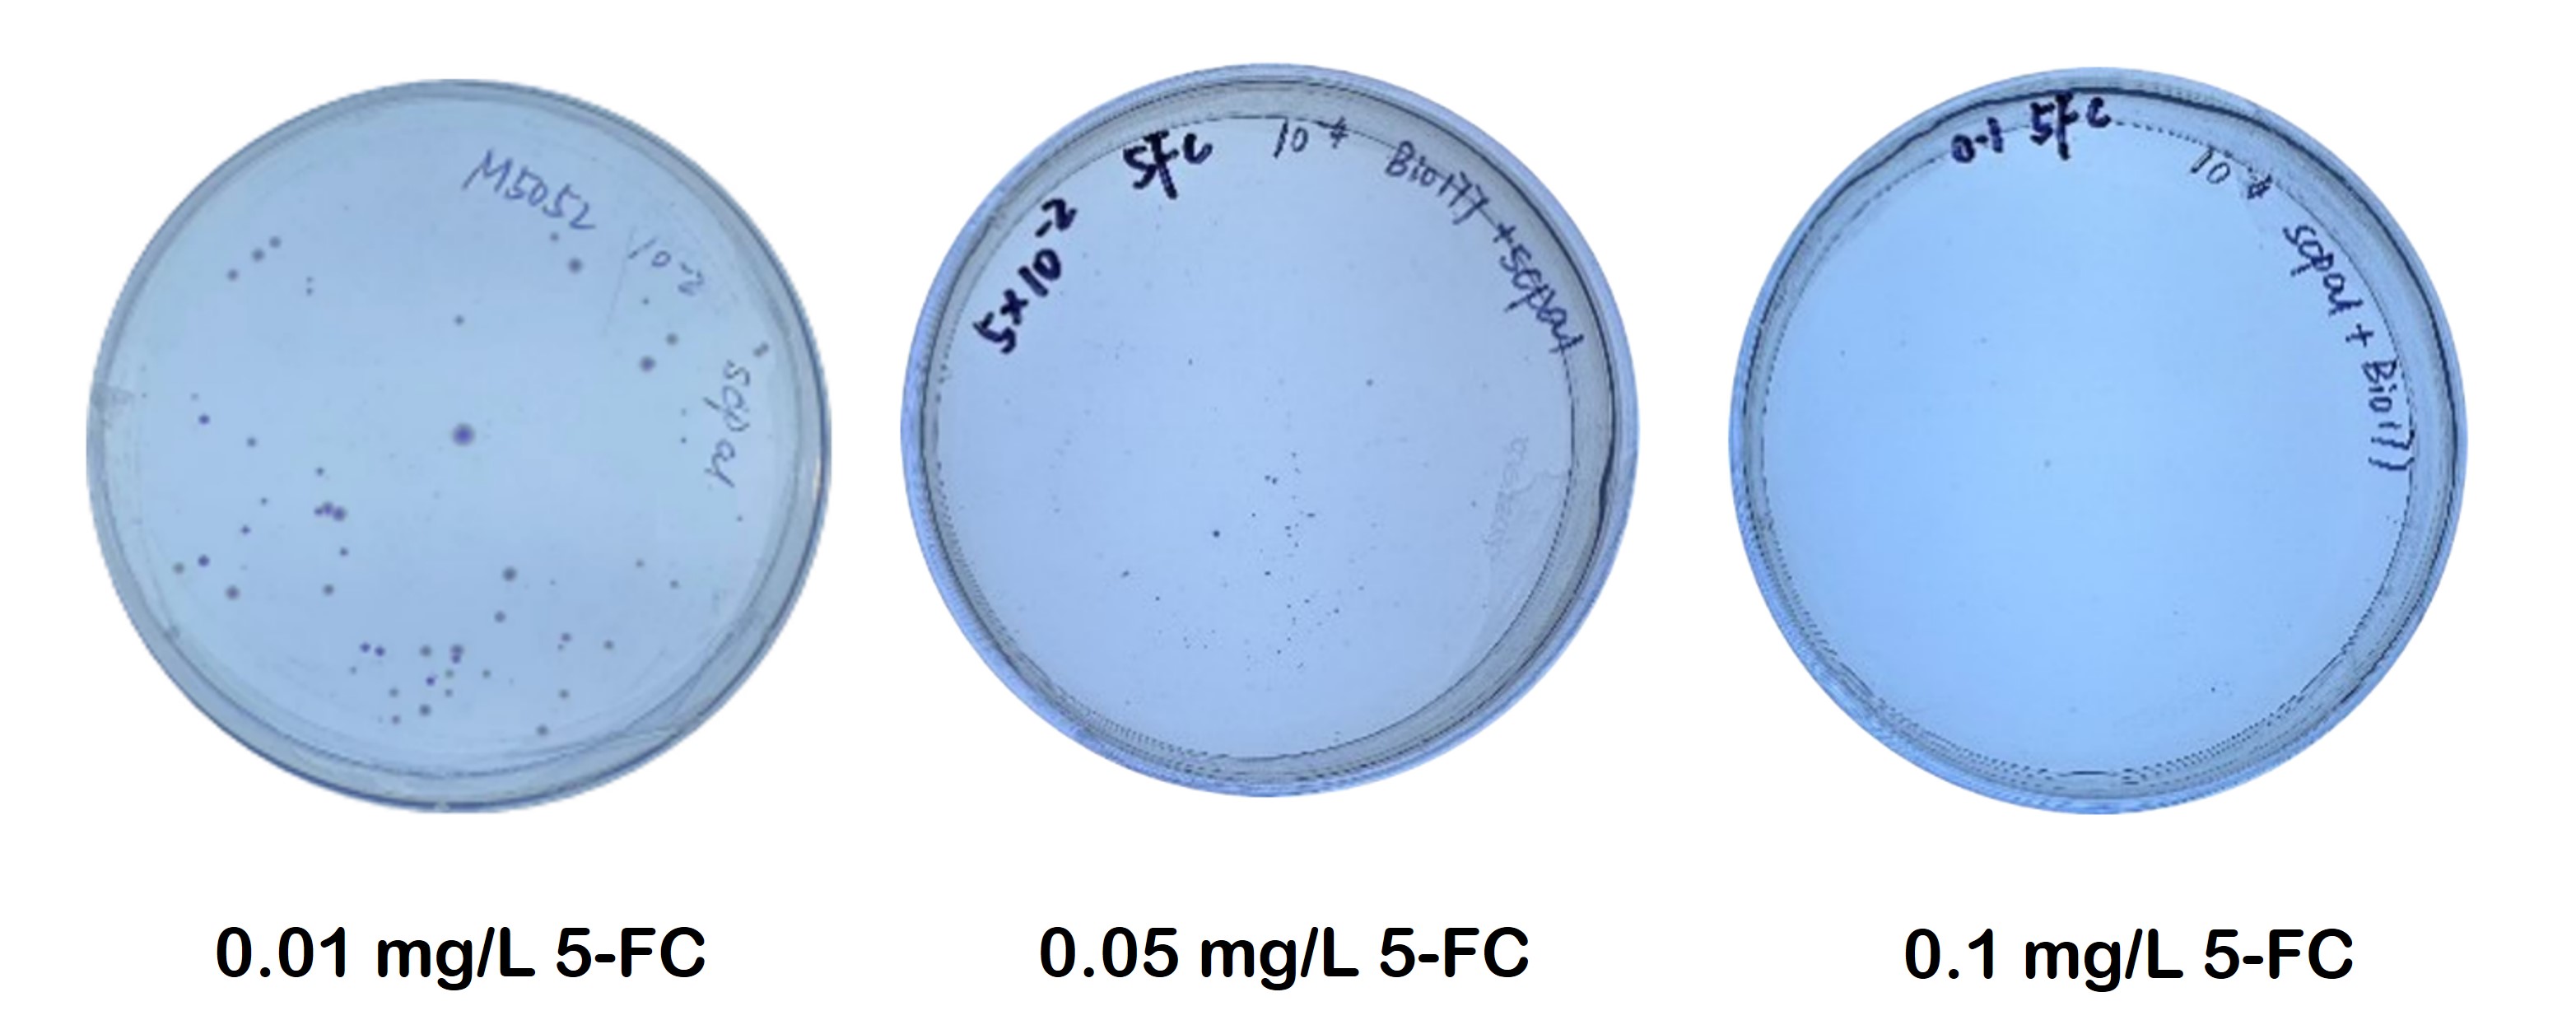
Figure 2. Spread strains on selection plates containing 0.01, 0.05 and 0.1 mg/L of 5-FC to simulate the screening process under stress conditions.
Screening to Obtain Excellent Mutants
We transferred the bacterial cultures into the selection media and cultivated the bacteria at 30°C until the bacteria reached the exponential phase (OD600 =0.2 or 0.6). With increased 5-FC concentrations, the selection pressure accelerated, which enhanced the performance of viable individuals, improved HMA production, and reduced fluorescence intensity. Based on colony fluorescence and HMA production, we screened clones under the conditions of 0.6 g/L HPP and 0.3 mg/L 5-FC (Fig. 3). And we found a mutant clone HmaSV152G that HMA production of mutant clones could increase up to 125% compared to that of WT (Fig. 4).
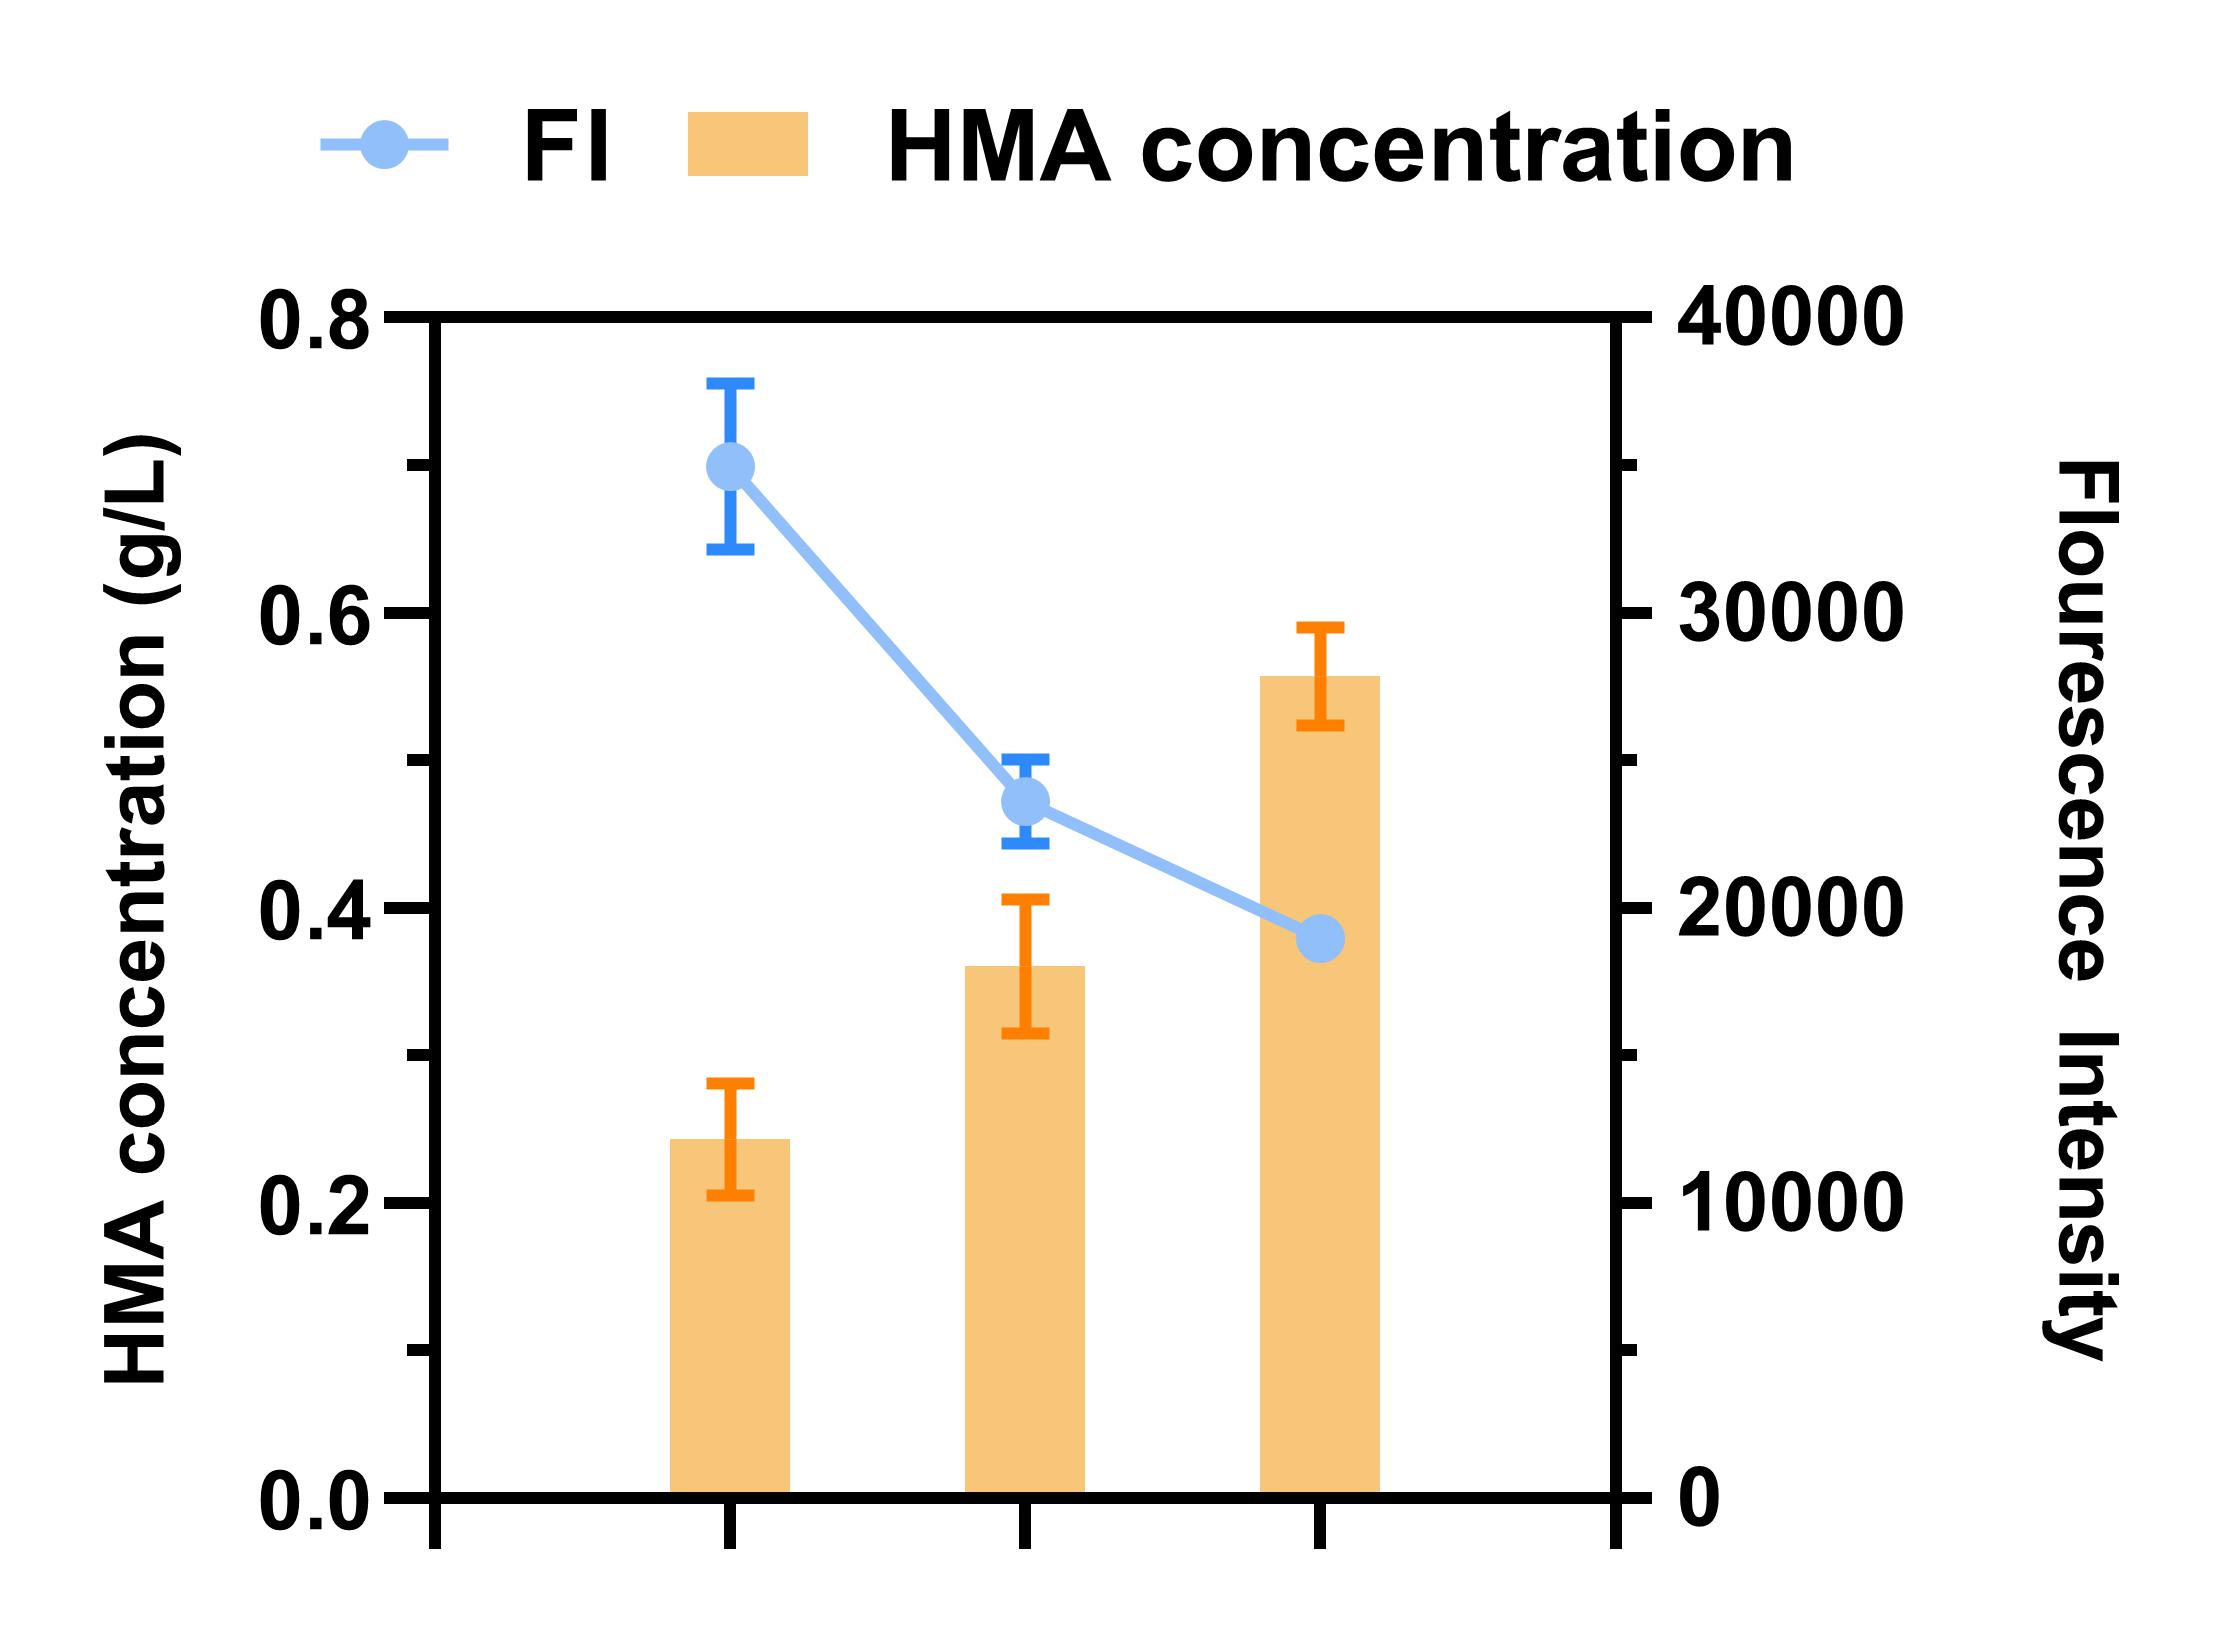
Figure 3. Graph of the correlation between 5-FC concentration in the medium and HMA production. The orange bars represent HMA levels and blue line depicts fluorescence intensity.
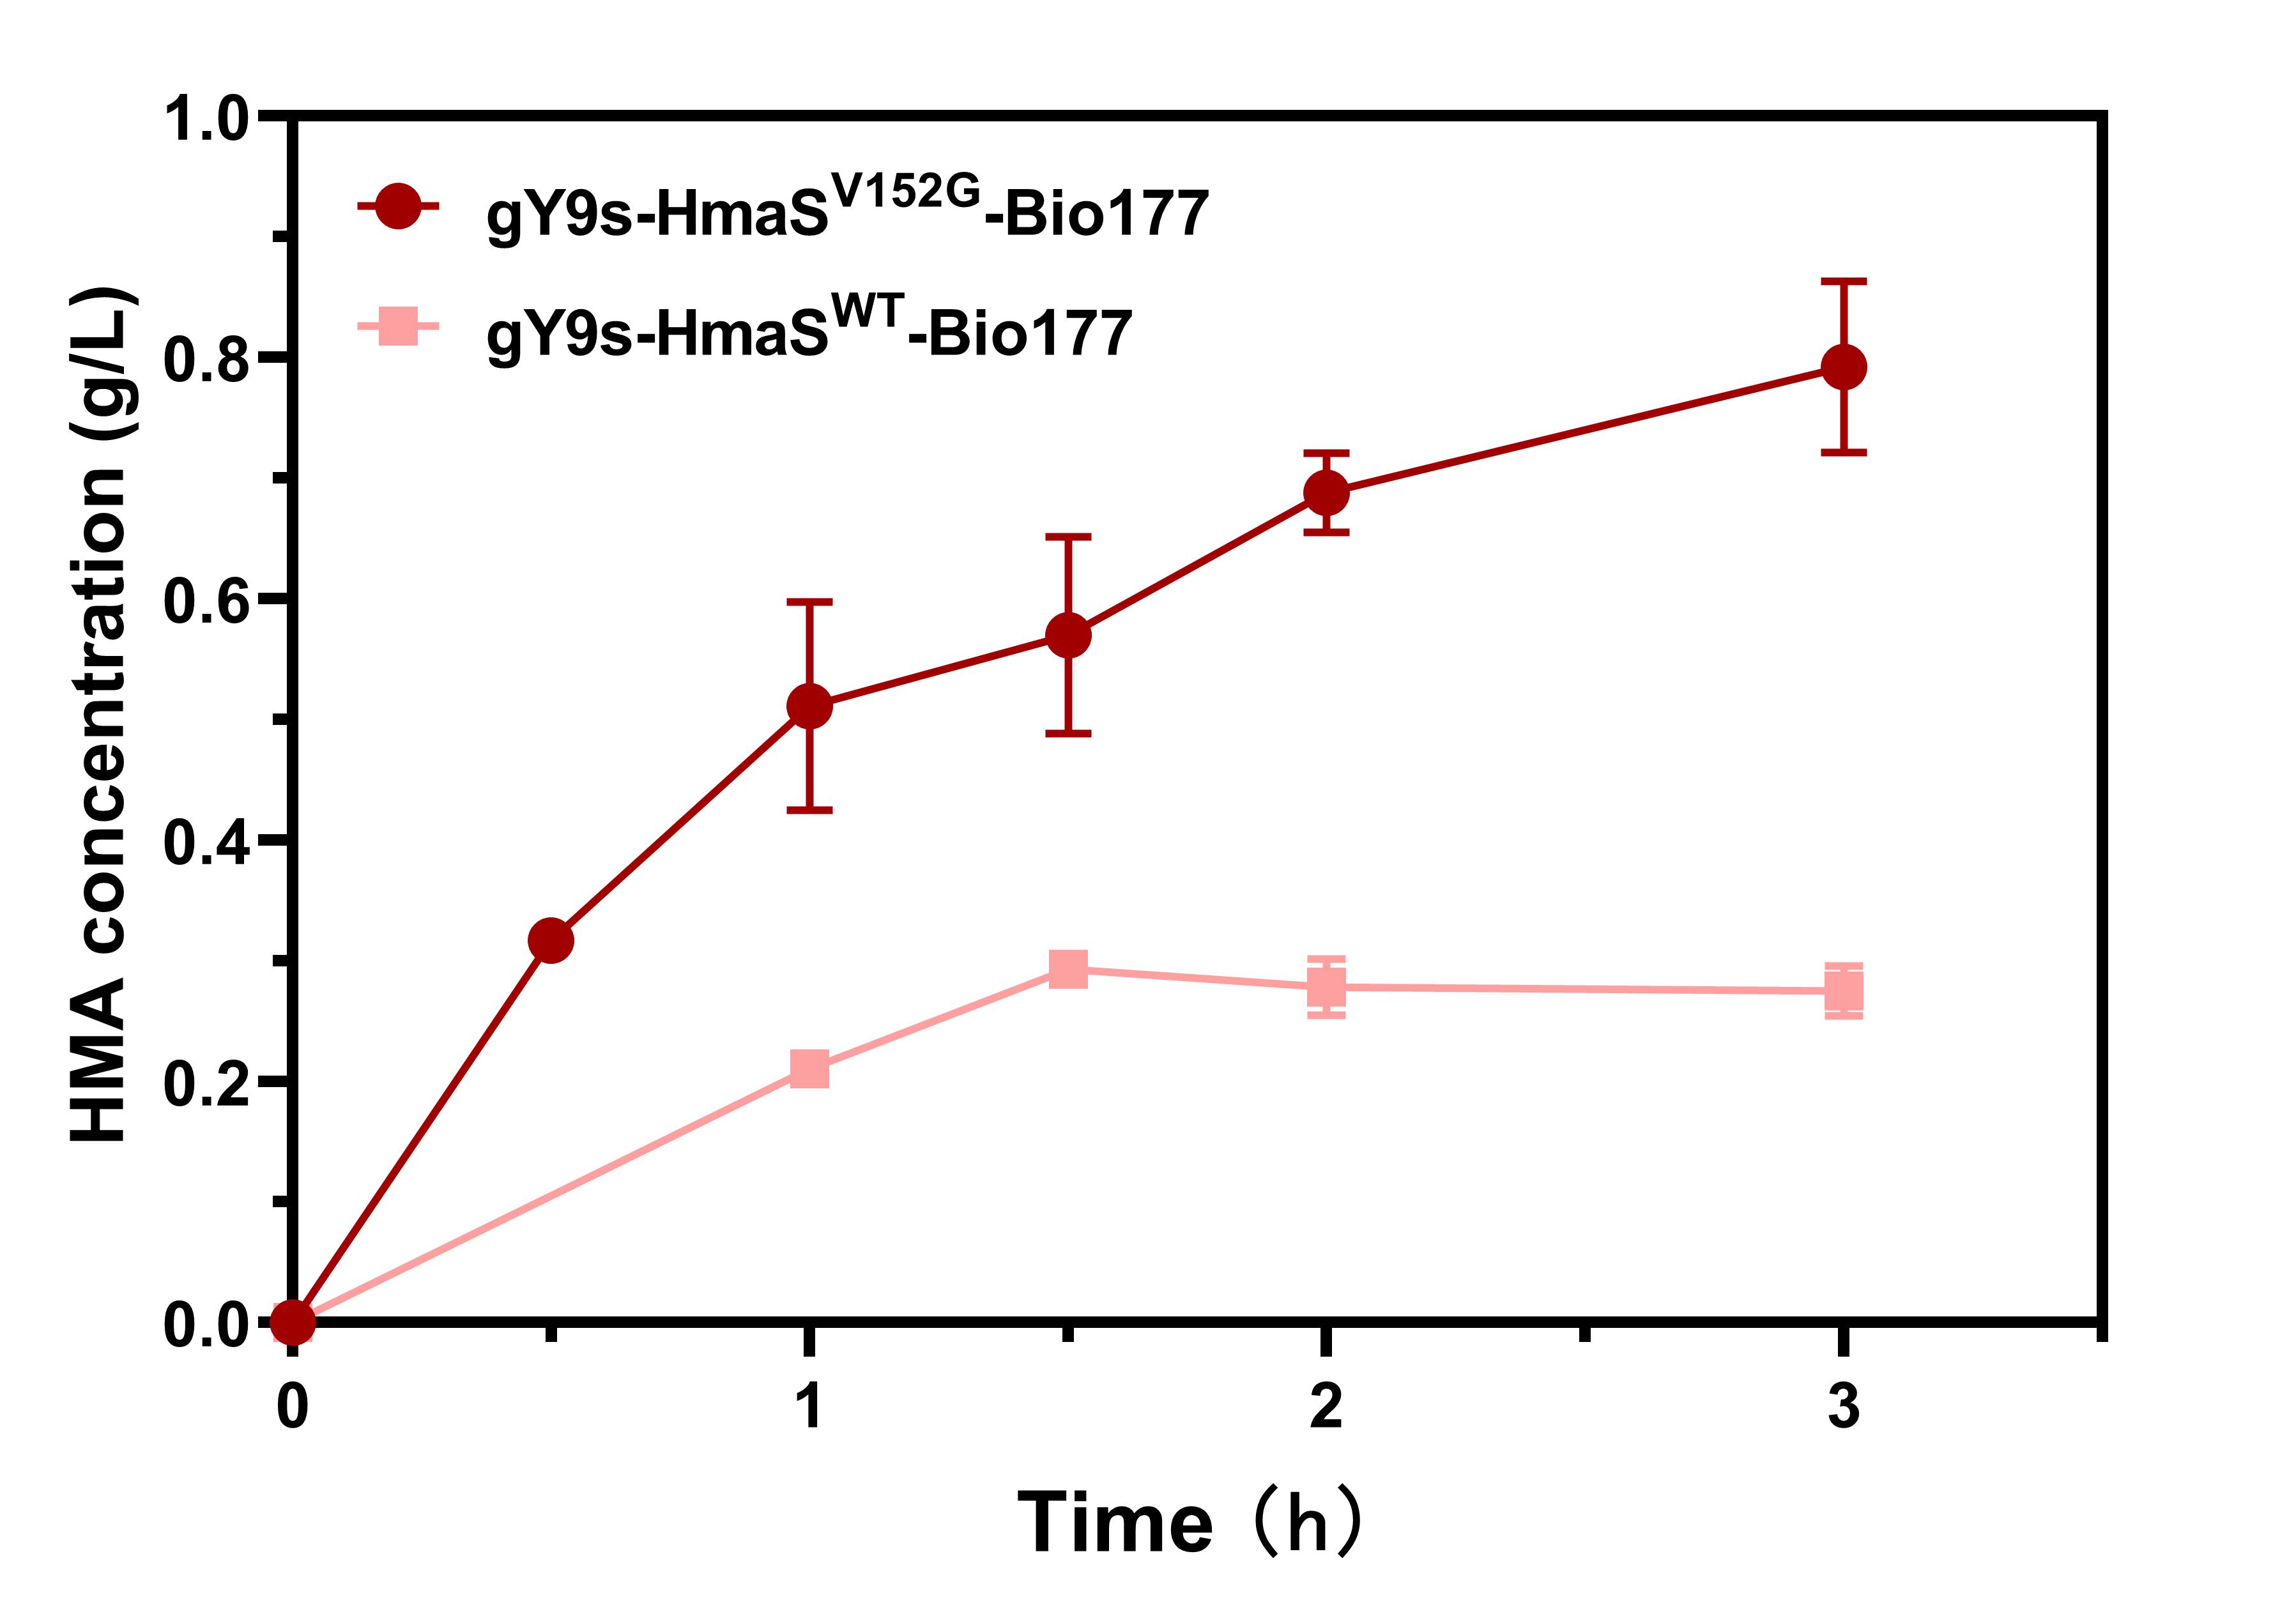
Figure 4. Graph of HMA production by the bacteria harboring HmaSWT and HmaSV152G clones. With 9 mM HPP as the substrate for whole-cell catalysis, HMA accumulation by the gY9s-HmaSV152G-Bio177 and gY9s-HmaSWT-Bio177 strains was monitored for 3 h.
Modeling and Molecular Docking
We employed the Alphafold2 for homology modeling of both the HmaSWT and mutant HmaSV152G (Fig. 5).
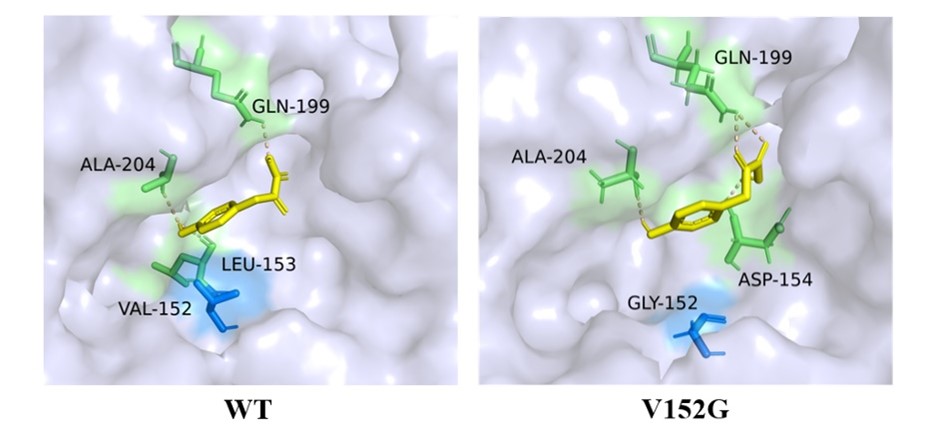
Figure 5. The surface models for the spatial structures of the HmaSWT and HmaSV152G mutants in the binding domain of HmaS. The residue 152 is colored in dark blue. The V152G mutation alters the positions of adjacent residues and subsequently increases the wideness of the pocket to easily accommodate HPP molecules.
we used the Autodock Vina to dock the HPP molecule to HmaS proteins. The docking energy of HPP with WT and V152G mutant was determined as -3.8 and -4.7 kcal/mol, respectively, indicating that HPP is likely better oriented towards the HmaS mutant. Following docking analysis, we evaluated the ligand-protein interactions using Pymol and Ligplus. After HPP docking with HmaSV152G, HPP forms hydrogen bonds with D154, G199 and A204, and engages in hydrophobic interactions with L153, G203, T206 and R318 (Fig. 6)
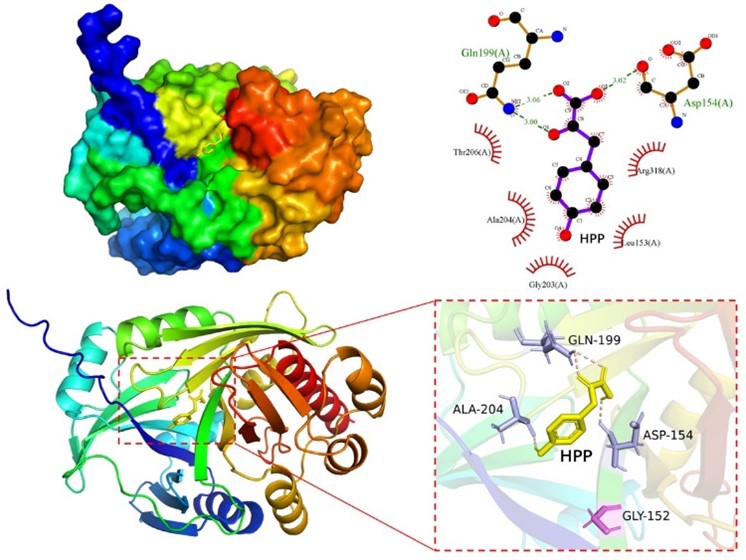
Figure 6. Simulated structures of HmaSV152G-HPP binding analyzed by Pymol and Ligplus. Compared to HmaSWT and mutant, HmaSV152G uses G152, L154 and E199 to form additional hydrogen bonds with a HPP molecule.
Engineering an E. coli Chassis with High-HPP Production
Overexpression of Key Genes to Enhance the Precursor Supply
We constructed the pSB1c-aroGfbr-tktA-ppsA (pATP) plasmid to overexpress the phosphoenol-pyruvate synthase (ppsA) gene, the transketolase (tktA) gene and aroGfbr gene. Through the modifications of genetic overexpression, we obtained a host strain that could produce up to 0.72 g/L HPP.
Building Multi-level Inhibition Platform Based on CRISPRi
Functional testing
To test the feasibility of multi-level interference, we co-transformed E. coli BW25113 with R6K-dCas9-eGFP plasmid containing the sgRNA targeting the eGFP coding sequence (+40bp) and pYB1a-eGFP plasmid. We tested the effectiveness of sgRNAs with different mismatches in mediating eGFP suppression. The eGFP repression levels is from 6.2% to 80.3% (Fig. 7).

Figure 7. Bar graph of the inhibitory efficiency by the random double-mismatched eGFP-sgRNAs. Fi means fully interference, transformed into the strain that containing the non-mutated R6K-dCas9-eGFP plasmid, which had CA in the 7-8bp spacer of the sgRNA.
Screening to Obtain Excellent Mutants
We individually co-transformed the plasmids of these R6K-dCas9-sgRNA single or four mismatch sgRNA libraries and non-mismatch sgRNA with the pSB1c-aroGfbr-tktA-pheA plasmid into E. coli BWΔCD, induced them in the ZYM5052 medium, and transferred them into M9 medium containing 20 g/L glucose for fermentation. After 24 h of cultivation, we performed HPLC analysis to test their HPP production. Especially, when tyrR was silenced, a significant increase of HPP was achieved with an improvement of 113.6% (0.704 g/L) compared to the strains only expressing the enhanced upstream pathways. We selected a non-mutant tyrRi strain for flask fermentation, and the HPP titer reached 0.91 g/L (Fig. 8).

Figure 8. Bar graph of HPP production with different genes inhibited by CRISPRi. The blue column represents the strain transformed by pATP, the green column is for the strain transformed by pATP and R6K-dCas9-sgRNA, and the orange columns indicate the strain transformed by pATP and R6K-dCas9-sgRNA mutants. The control group was the BWΔCD strain carrying no plasmid.
Evaluation of Metabolic Engineering and Directed Evolution
The optimized clones (gY9s-HmaSV152G-Bio177) obtained from the screening were transformed into the bacterial host (pATP or tyrRi). The experiment groups were listed in the Table 1. After cultivation and induced protein expression, the bacteria were transferred to a fermentation medium using glucose as the substrate and fermented in a shake flask at 30°C for 8 h.
Table 1. List of plasmids used to generate different strains in each group for fermentation.

Compared HMA1, HMA3 and HMA5 clones, we found that gene overexpression or silencing alone had limited effects on overall fermentation promotion. However, when two approaches are combined, it allowed the endogenous HPP synthesis pathway to achieve balanced, stable and sustained expression, lead to a remarkable increase in the fermentation yield.
Contrasted the HMA1 and HMA2, HMA3 and HMA4, HMA5 and HMA6 pairs, we found that the essential limiting factor was the enzymatic activity of hydroxymandelate synthase, which significantly restricted HMA production (Fig. 9).

Figure 9. Bar graph to compare relative HMA levels produced by different strains. Solid black dots indicate the presence of the plasmids, hollow black dots indicate their absence.
Fermentation was carried out for a long time using the HMA5 and HMA6 clones. Aliquots were collected every two hours, compared with HmaSWT, the HmaSV152G obtained through the screening, showed a 4.73-fold increase in HMA production and produced 3.63 g/L HMA after 24 h with a single supply of 20 g/L glucose (Fig. 10).
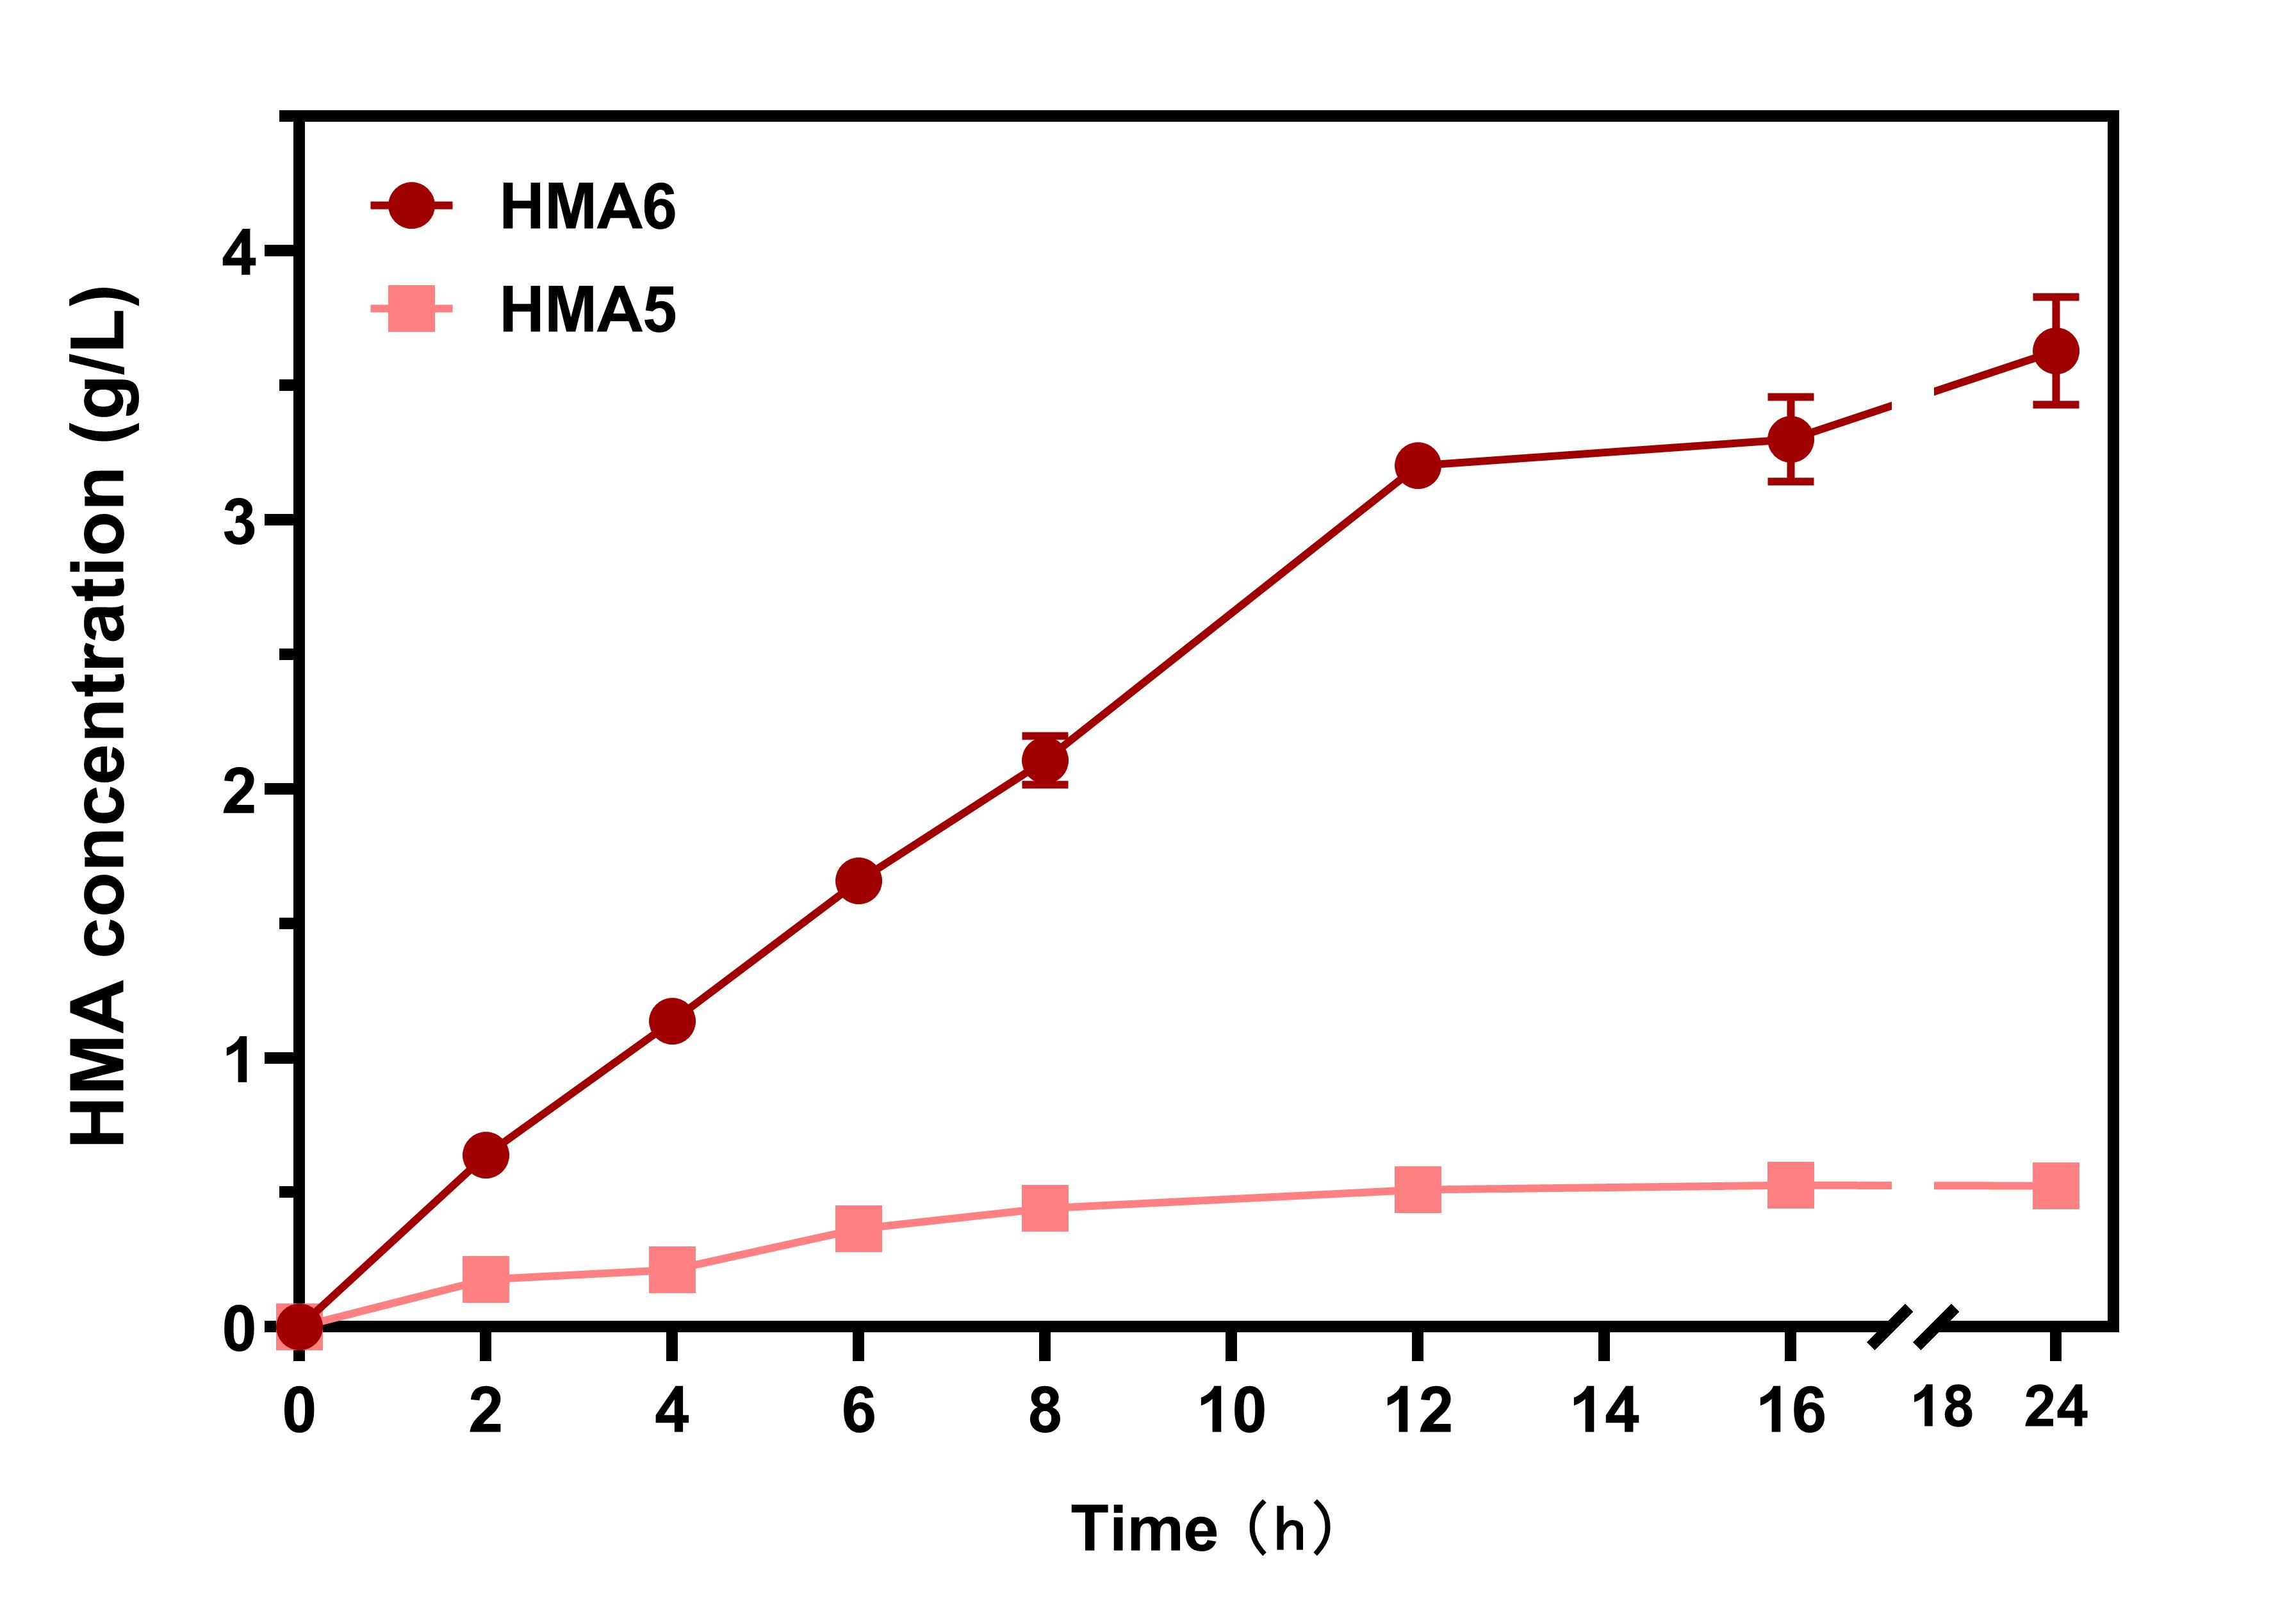
Figure 10.Comparison of HMA production by the HMA5 and HMA6 strains. The bacteria were fermented in shaking flasks for 24 h with a single supply of 20 g/L glucose as the substrate, and HMA levels monitored at indicated time points
