Results
Salt growth curve of BL21 (DE3) cells
In order to determine the level of growth and salt tolerance in Escherichia coli BL21 (DE3), a growth curve was made, incubating the E.coli in various concentrations of NaCl in LB media. 29ml LB media was inoculated with 1ml overnight culture of E.coli and the initial OD600 was measured. This was then followed by measurements taking 1ml of media every hour for 6 hours. 1% salt has been removed as the initial OD600 was significantly higher than those of the others, which may have affected the results. The results showed a significant decrease in growth after 6 hours of the E.coli BL21 after 3% NaCl (w/v) LB (Figure 1). The doubling time of the E.coli can be seen to steadily increase until 3.5% where the doubling time begins to increase significantly as the concentration of salt in the medium rises (Table 1). The E.coli grown in 0.5% salt (no additional salt), grew at the fastest rate for the first 5 hours with a doubling time of 1.05 hours in comparison to 1.5% salt with a doubling time of 1.09 hours, however more testing would be necessary to determine if this difference is due to increased salt in the medium. The E.coli grown at 0.5% then saw a decline between hours 5 and 6, which was not mirrored in other cultures at different concentrations. However, a decline before recover had been seen in other cultures, such as 3.5% in hour 5.
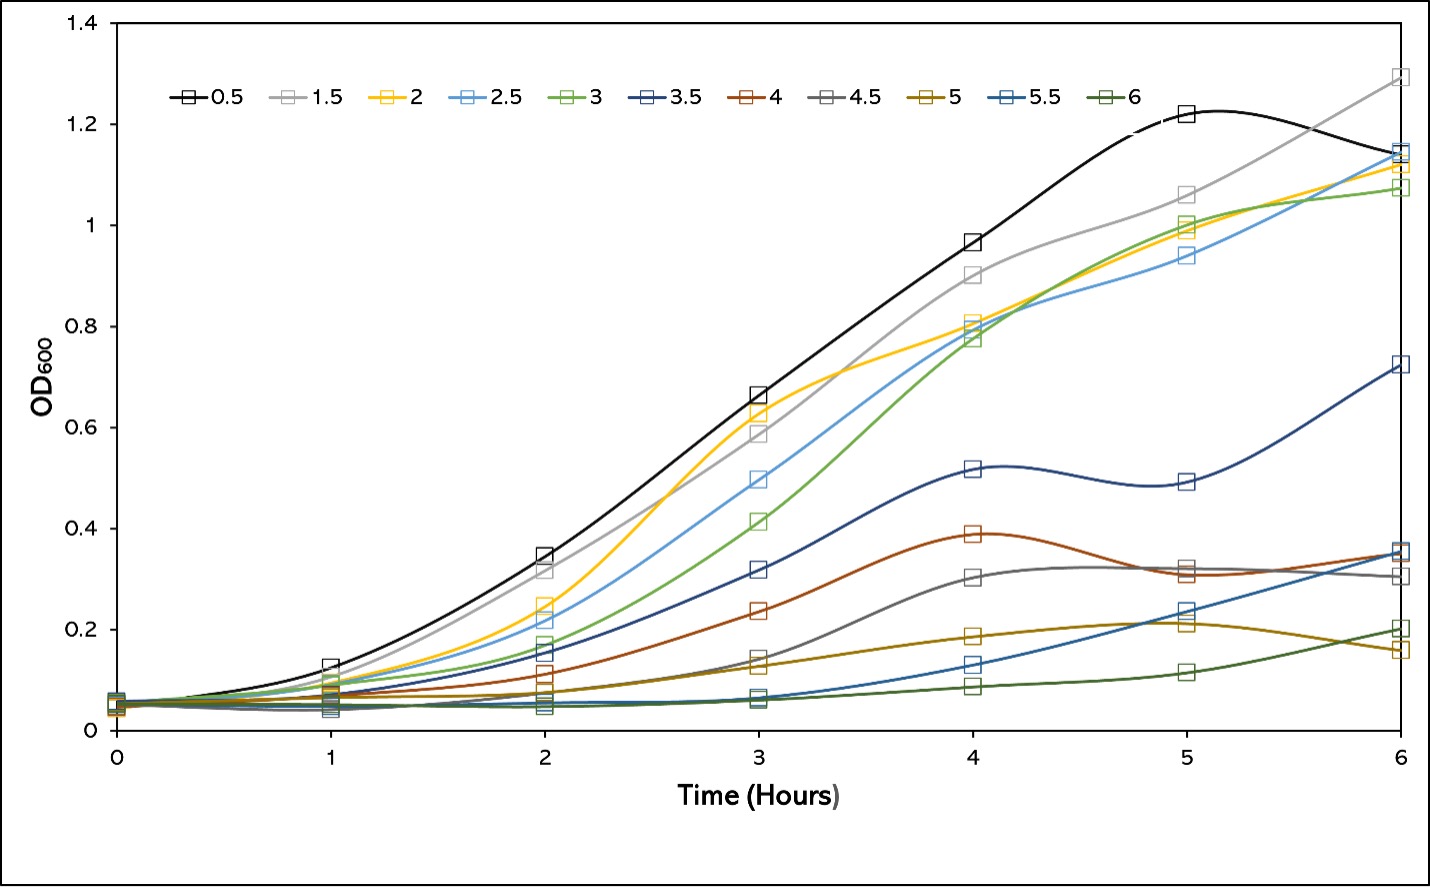
Figure 1 - 6 hour Growth Curve of BL21 (DE3) Cells In LB Media of Varying Salt Concentrations. 1% Salt LB was removed due to likely error in protocol effecting results. LB media containing various salt concentrations were inoculated with BL21 (DE3) Overnight culture and the OD600 was measured every hour to measure the growth of the Escherichia coli.
The Effect Salt Concentration on E coli. Doubling Times
| Lysogeny Broth Salt Concentration (%) | Doubling Time at 6 Hours (Hours) |
|---|---|
| 0.5 | 1.29 |
| 1.0 | 1.38 |
| 1.5 | 1.23 |
| 2.0 | 1.26 |
| 2.5 | 1.32 |
| 3.0 | 1.40 |
| 3.5 | 1.65 |
| 4.0 | 2.05 |
| 4.5 | 2.35 |
| 5.0 | 3.85 |
| 5.5 | 2.27 |
Table 1 - Doubling Times of Salty E.coli Cultures at 6 hours. Doubling times were calculated using the formula Dt = hours/ log2( final OD600/ Initial OD600)
stpA level T
Due to being unsuccessful in extracting purified stpA gene from genomic DNA, a gene block was designed to be inserted into a cyanogate level T vector with correct cut sites and overhangs for an assembly reaction wherein the restriction enzyme bbsI would cut the gene block revealing sticky ends which could then be ligated into the level T vector. A level T recation was conducted and the reaction product was transformed into TOP10 cells which were then spread onto XGAL-IPTG plates for blue/white selection. White colonies were then picked and colony PCR was conducted to confirm successful transformation. The PCR product was then run on 1% agarose gel and the gel was analysed using a UV imager (Figure 2). The results showed bands of the expected size across the white colonies indicating that the plasmid had been successfully constructed and transformed.
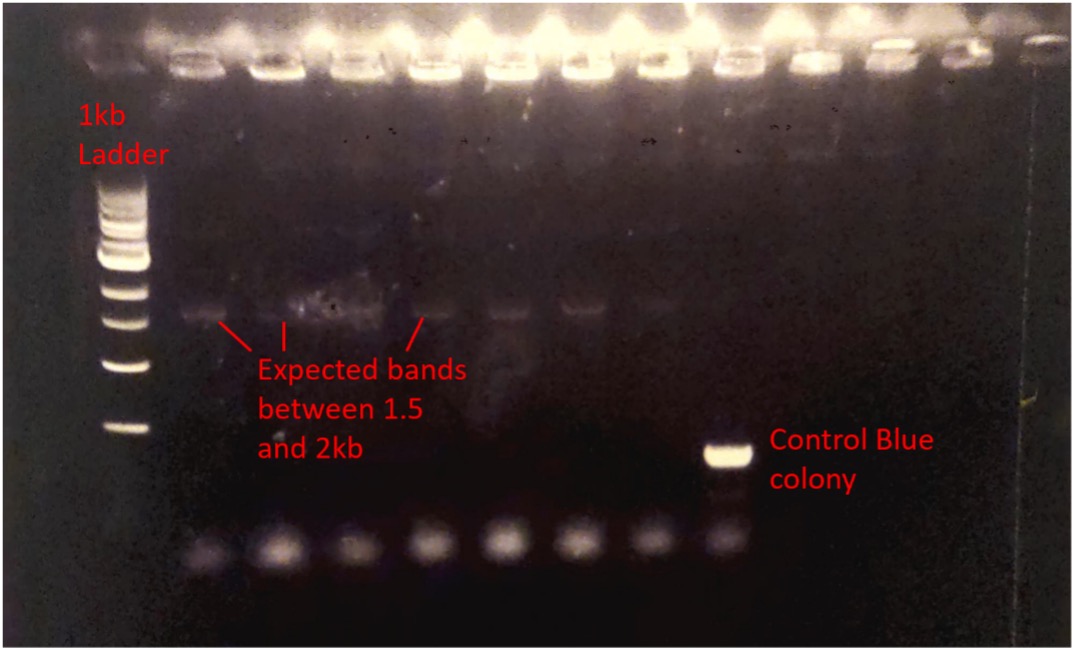
Figure 2 - Imaged Agarose gel electrophoresis. Colony PCR was performed generating bands at the expected positions between 1.5 and 2kb.
Mutant Library Generation
The ggpS gene was extracted from Synechocystis sp. PCC 6803 by PCR from genomic DNA. The gene was then purified by gel extraction and ligated in an assembly reaction into the cyanogate level 0 backbone. A further digestion and ligation was performed in order to assemble the gene along with the constitutive promoter ptrc10, which functions in both Synechocystis as well as E.coli and the terminator pC0.082. This level 1 assembly was then transformed into E.coli TOP10 cells and confirmed by colony PCR and digestion. However the final plasmid was found to be around 1kb larger than anticipated (Figure 3). Nevertheless, the correct band sizes indicating that ggpS has been successfully ligated into the level 1 vector and transformed were present. The decision was then made to proceed with error prone PCR using ggpS in this backbone.
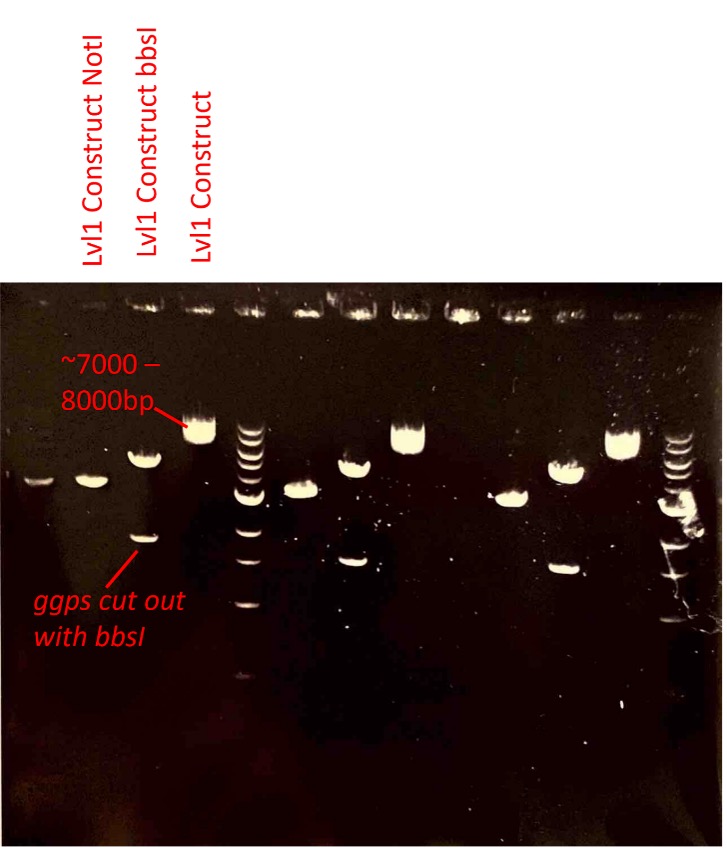
Figure 3 - Agarose Gel Electrophoresis image of undigested Level 1 construct and digested with NotI and BbsI. Plasmid miniprep was digested with NotI and bbsI and run on 1% agarose gel in gel electrophoresis and imaged. Repeats can be found on the right.
However after repeated attempts this error prone PCR was unsuccessful as when ran with dye on 1% Agarose gel and imaged, the bands indicated two PCR products, one at 4.5kb and one at 2.5kb consistently. In silico there was considered no reason to believe that primer mis-annealing should take place and so it was hypothesised that either the plCH47732 level 1 acceptor vector, the PTRC10 promoter or pC0.082 terminator in level 0 was incorrect. A PCR reaction was performed using the level 0, level 1 and genomic PCR extract as template DNA and all templates except the level 1 were successful (Figure 4).
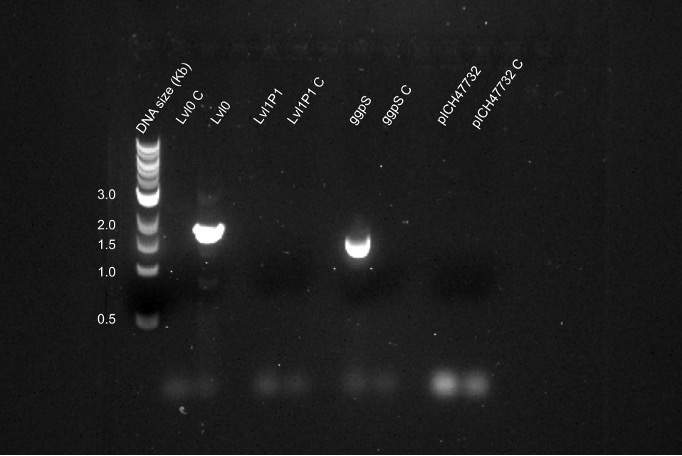
Figure 4 - Agarose gel electrophoresis image: Q5 PCR of ggpS from ggpS, lvl0 and lvl1P1 templates, and Q5 of pICH47732 backbone from lvl1 template.
After a subsequent attempt utilising longer extension times, the colony PCR indicated successful assembly and transformation of the epPCR library (Figure 5). The bands were at approximately 1.8kb as expected in colonies 1, 2 and 4. These results were not demonstrated in our final report. The error prone PCR library was then transferred to the Edinburgh Genome Foundry, along with chemically competent cells for heat shock containing the stpA level T plasmid for transformation and subsequent performance of the assay.
To circumvent the plCH47732 backbone, epPCR of ggpS was performed again using the level 0 assembly as a template and NEB Taq polymerase. The genomic Forward and Genomic Reverse primers were used, as these when digested, would generate the overhangs necessary to assemble into a pJUMP29-1A acceptor vector with a constitutive PJ23100 promoter, pET ribosome binding site and L3SAP51 terminator. The resulting library was digested with BbsI, creating 1.5kb double stranded linear DNA fragments. These digested fragments were then used in a level 1 JUMP assembly reaction to generate level 1 constructs with a GFP selection marker. Fluorescent colonies were picked for colony PCR in order to check for successful assembly and transformation. However the first attempt was unsuccessful.
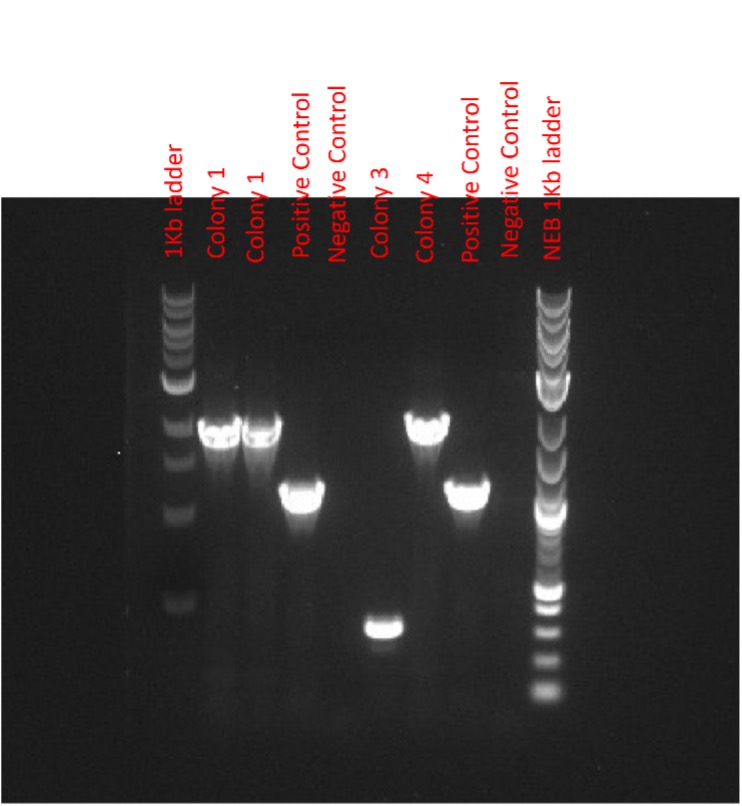
Figure 5 – UV Imaged Agarose Gel electrophoresis. 4 Colonies were picked for colony PCR using P1 and P2 primers. Results show colony 1,2 and 4 with the expected band size.